HP 2009 Annual Report Download - page 67
Download and view the complete annual report
Please find page 67 of the 2009 HP annual report below. You can navigate through the pages in the report by either clicking on the pages listed below, or by using the keyword search tool below to find specific information within the annual report.-
 1
1 -
2
-
3
-
4
-
5
-
6
-
7
-
8
-
9
-
10
-
11
-
12
-
13
-
14
-
15
-
16
-
17
-
18
-
19
-
20
-
21
-
22
-
23
-
24
-
25
-
26
-
27
-
28
-
29
-
30
-
31
-
32
-
33
-
34
-
35
-
36
-
37
-
38
-
39
-
40
-
41
-
42
-
43
-
44
-
45
-
46
-
47
-
48
-
49
-
50
-
51
-
52
-
53
-
54
-
55
-
56
-
 57
57 -
 58
58 -
 59
59 -
 60
60 -
 61
61 -
 62
62 -
 63
63 -
 64
64 -
 65
65 -
 66
66 -
 67
67 -
 68
68 -
 69
69 -
 70
70 -
 71
71 -
 72
72 -
 73
73 -
 74
74 -
 75
75 -
 76
76 -
 77
77 -
78
-
79
-
80
-
81
-
82
-
83
-
84
-
85
-
86
-
87
-
88
-
89
-
90
-
91
-
92
-
93
-
94
-
95
-
96
-
97
-
98
-
99
-
100
-
101
-
102
-
103
-
104
-
105
-
106
-
107
-
108
-
109
-
110
-
111
-
112
-
113
-
114
-
115
-
116
-
117
-
118
-
119
-
120
-
121
-
122
-
123
-
124
-
125
-
126
-
127
-
128
-
129
-
130
-
131
-
132
-
133
-
134
-
135
-
136
-
137
-
138
-
139
-
140
-
141
-
142
-
143
-
144
-
145
-
146
-
147
-
148
-
149
-
150
-
151
-
152
-
153
-
154
-
155
-
156
-
157
-
158
-
159
-
160
-
161
-
162
-
163
-
164
-
165
-
166
-
167
-
168
-
169
-
170
-
171
-
172
-
173
-
174
-
175
-
176
-
177
-
178
-
179
-
180
-
181
-
182
-
183
-
184
-
185
 |
 |

HEWLETT-PACKARD COMPANY AND SUBSIDIARIES
Management’s Discussion and Analysis of
Financial Condition and Results of Operations (Continued)
weaker demand environment, the effects of which were partially offset by revenue resulting from the
acquisition of Lefthand Networks, which was completed in the first quarter of fiscal 2009.
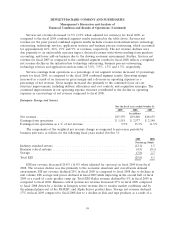
In fiscal 2009, ESS earnings from operations as a percentage of net revenue decreased by
3.4 percentage points compared to fiscal 2008, due primarily to a decline in gross margin. Gross margin
in fiscal 2009 decreased due primarily to competitive pricing across each of the segment business units
and product mix shifts. Operating expense as a percentage of net revenue in fiscal 2009 was generally
consistent with the fiscal 2008.
ESS net revenue increased 4.1% (decreased 0.5% when adjusted for currency) in fiscal 2008 from
fiscal 2007. Storage net revenue increased 13% in fiscal 2008 compared to fiscal 2007, with strong
performance in mid-range EVA, entry MSA, tape media and storage software. Industry standard servers
net revenue grew 2% in fiscal 2008 compared to fiscal 2007 as a result of growth in blade revenue and
unit volumes. Revenue growth in the industry standard servers business was partially offset by the
decline in average unit prices driven by market movement to low-end product lines and component cost
declines. Business critical systems net revenue growth was flat in fiscal 2008 compared to fiscal 2007.
Integrity servers net revenue grew 22% in fiscal 2008 and represents 79% of the business critical
systems revenue mix, up from 64% in fiscal 2007. The increase was offset by revenue declines in the
PA-RISC product line and the planned phase-out of our Alpha Server product line. Integrity servers
revenue in fiscal 2008 also included revenue from Montvale-based Integrity servers.
In fiscal 2008, ESS earnings from operations as a percentage of net revenue increased by
1.8 percentage points compared to fiscal 2007, due primarily to a decrease in operating expenses as a
percentage of net revenue. Gross margin increased slightly in fiscal 2008 compared to fiscal 2007 due
primarily to cost management and improved attach rates in industry standard servers, the effect of
which was mostly offset by competitive pricing in storage and industry standard servers and a mix shift
to entry level integrity servers. The decrease in operating expense as a percentage of net revenue in
fiscal 2008 was due primarily to continued cost structure improvements.
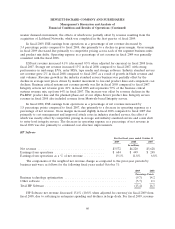
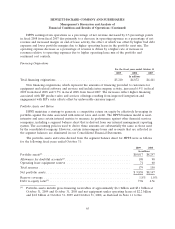
HP Software
For the fiscal years ended October 31
2009 2008 2007
In millions
Net revenue ...................................... $3,572 $4,220 $3,628
Earnings from operations ............................ $ 684 $ 499 $ 248
Earnings from operations as a % of net revenue ............ 19.1% 11.8% 6.8%
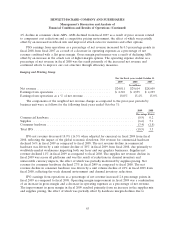
The components of the weighted net revenue change as compared to the prior-year periods by
business unit were as follows for the following fiscal years ended October 31:
2009 2008
Percentage Points
Business technology optimization ................................... (9.7) 14.2
Other software ................................................ (5.7) 2.1
Total HP Software .............................................. (15.4) 16.3
HP Software net revenue decreased 15.4% (10.8% when adjusted for currency) in fiscal 2009 from
fiscal 2008, due to softening in enterprise spending and declines in large deals. For fiscal 2009, revenue
60