HP 2009 Annual Report Download - page 166
Download and view the complete annual report
Please find page 166 of the 2009 HP annual report below. You can navigate through the pages in the report by either clicking on the pages listed below, or by using the keyword search tool below to find specific information within the annual report.-
 1
1 -
2
-
3
-
4
-
5
-
6
-
7
-
8
-
9
-
10
-
11
-
12
-
13
-
14
-
15
-
16
-
17
-
18
-
19
-
20
-
21
-
22
-
23
-
24
-
25
-
26
-
27
-
28
-
29
-
30
-
31
-
32
-
33
-
34
-
35
-
36
-
37
-
38
-
39
-
40
-
41
-
42
-
43
-
44
-
45
-
46
-
47
-
48
-
49
-
50
-
51
-
52
-
53
-
54
-
55
-
56
-
57
-
58
-
59
-
60
-
61
-
62
-
63
-
64
-
65
-
66
-
67
-
68
-
69
-
70
-
71
-
72
-
73
-
74
-
75
-
76
-
77
-
78
-
79
-
80
-
81
-
82
-
83
-
84
-
85
-
86
-
87
-
88
-
89
-
90
-
91
-
92
-
93
-
94
-
95
-
96
-
97
-
98
-
99
-
100
-
101
-
102
-
103
-
104
-
105
-
106
-
107
-
108
-
109
-
110
-
111
-
112
-
113
-
114
-
115
-
116
-
117
-
118
-
119
-
120
-
121
-
122
-
123
-
124
-
125
-
126
-
127
-
128
-
129
-
130
-
131
-
132
-
133
-
134
-
135
-
136
-
137
-
138
-
139
-
140
-
141
-
142
-
143
-
144
-
145
-
146
-
147
-
148
-
149
-
150
-
151
-
152
-
153
-
154
-
155
-
 156
156 -
 157
157 -
 158
158 -
 159
159 -
 160
160 -
 161
161 -
 162
162 -
 163
163 -
 164
164 -
 165
165 -
 166
166 -
 167
167 -
 168
168 -
 169
169 -
 170
170 -
 171
171 -
 172
172 -
 173
173 -
 174
174 -
 175
175 -
 176
176 -
177
-
178
-
179
-
180
-
181
-
182
-
183
-
184
-
185
 |
 |

HEWLETT-PACKARD COMPANY AND SUBSIDIARIES
Notes to Consolidated Financial Statements (Continued)
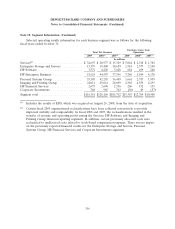
Note 19: Segment Information (Continued)
Net revenue by segment and business unit
The following table provides net revenue by segment and business unit for the following fiscal
years ended October 31:
2009 2008(2) 2007(2)
In millions
Net revenue:
Infrastructure technology outsourcing .................... $ 15,751 $ 7,488 $ 4,671
Technology services .................................. 9,789 10,297 9,441
Application services ................................. 6,032 2,411 1,102
Business process outsourcing ........................... 2,941 723 115
Other ........................................... 180 58 —
Services(1) .......................................... 34,693 20,977 15,329
Industry standard servers ............................. 9,296 11,657 11,380
Storage .......................................... 3,473 4,205 3,706
Business critical systems .............................. 2,590 3,538 3,553
Enterprise Storage and Servers ........................... 15,359 19,400 18,639
Business technology optimization ........................ 2,385 2,792 2,276
Other software ..................................... 1,187 1,428 1,352
HP Software ........................................ 3,572 4,220 3,628
HP Enterprise Business .................................. 53,624 44,597 37,596
Notebooks ........................................ 20,210 22,657 17,650
Desktops ......................................... 12,864 16,643 15,889
Workstations ...................................... 1,261 1,885 1,721
Handhelds ........................................ 172 360 531
Other ........................................... 798 750 618
Personal Systems Group ................................. 35,305 42,295 36,409
Supplies .......................................... 16,532 18,472 17,018
Commercial hardware ................................ 4,778 7,422 7,371
Consumer hardware ................................. 2,701 3,720 4,220
Imaging and Printing Group .............................. 24,011 29,614 28,609
HP Financial Services ................................... 2,673 2,698 2,336
Corporate Investments .................................. 768 965 762
Total segments ..................................... 116,381 120,169 105,712
Eliminations of inter-segment net revenue and other ............. (1,829) (1,805) (1,426)
Total HP consolidated net revenue ...................... $114,552 $118,364 $104,286
(1) Includes the results of EDS, which was acquired on August 26, 2008, from the date of acquisition.
The businesses included in the former HP consulting and integration business unit were divided
among the application services and technology services business units and the HP Software
159