HP 2009 Annual Report Download - page 66
Download and view the complete annual report
Please find page 66 of the 2009 HP annual report below. You can navigate through the pages in the report by either clicking on the pages listed below, or by using the keyword search tool below to find specific information within the annual report.-
 1
1 -
2
-
3
-
4
-
5
-
6
-
7
-
8
-
9
-
10
-
11
-
12
-
13
-
14
-
15
-
16
-
17
-
18
-
19
-
20
-
21
-
22
-
23
-
24
-
25
-
26
-
27
-
28
-
29
-
30
-
31
-
32
-
33
-
34
-
35
-
36
-
37
-
38
-
39
-
40
-
41
-
42
-
43
-
44
-
45
-
46
-
47
-
48
-
49
-
50
-
51
-
52
-
53
-
54
-
55
-
 56
56 -
 57
57 -
 58
58 -
 59
59 -
 60
60 -
 61
61 -
 62
62 -
 63
63 -
 64
64 -
 65
65 -
 66
66 -
 67
67 -
 68
68 -
 69
69 -
 70
70 -
 71
71 -
 72
72 -
 73
73 -
 74
74 -
 75
75 -
 76
76 -
77
-
78
-
79
-
80
-
81
-
82
-
83
-
84
-
85
-
86
-
87
-
88
-
89
-
90
-
91
-
92
-
93
-
94
-
95
-
96
-
97
-
98
-
99
-
100
-
101
-
102
-
103
-
104
-
105
-
106
-
107
-
108
-
109
-
110
-
111
-
112
-
113
-
114
-
115
-
116
-
117
-
118
-
119
-
120
-
121
-
122
-
123
-
124
-
125
-
126
-
127
-
128
-
129
-
130
-
131
-
132
-
133
-
134
-
135
-
136
-
137
-
138
-
139
-
140
-
141
-
142
-
143
-
144
-
145
-
146
-
147
-
148
-
149
-
150
-
151
-
152
-
153
-
154
-
155
-
156
-
157
-
158
-
159
-
160
-
161
-
162
-
163
-
164
-
165
-
166
-
167
-
168
-
169
-
170
-
171
-
172
-
173
-
174
-
175
-
176
-
177
-
178
-
179
-
180
-
181
-
182
-
183
-
184
-
185
 |
 |

HEWLETT-PACKARD COMPANY AND SUBSIDIARIES
Management’s Discussion and Analysis of
Financial Condition and Results of Operations (Continued)
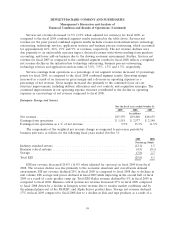
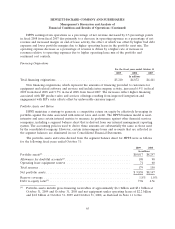
Services net revenue decreased 11.5% (3.8% when adjusted for currency) for fiscal 2009, as
compared to the fiscal 2008 combined segment results presented in the table above. Services net
revenue for the prior period combined segment results includes revenue from infrastructure technology
outsourcing, technology services, application services and business process outsourcing, which accounted
for approximately 46%, 26%, 19% and 9% of revenues, respectively. The net revenue declines were
due primarily to an unfavorable currency impact, deferred revenue write-down resulting from purchase
accounting, and lower add-on business due to the slowing economic environment. Further, Services net
revenue for fiscal 2009 as compared to the combined segment results for fiscal 2008 reflects a weighted
net revenue decline in the infrastructure technology outsourcing, business process outsourcing,
technology services and application services units of 5.0%, 3.9%, 1.3% and 1.3%, respectively.
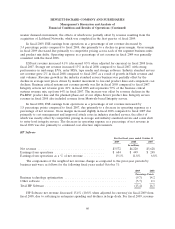
Services earnings from operations as a percentage of net segment revenue increased 6.3 percentage
points for fiscal 2009, as compared to the fiscal 2008 combined segment results. Operating margin
increased as a result of an increase in gross margin and a decrease in operating expenses as a
percentage of net revenue. Gross margin increased due primarily to the continued focus on cost
structure improvements, including delivery efficiencies and cost controls, and acquisition synergies. The
continued improvements in our operating expense structure contributed to the decline in operating
expenses as a percentage of net revenue compared to fiscal 2008.
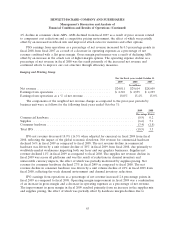
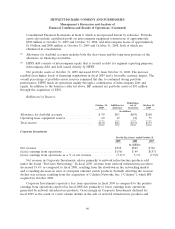
Enterprise Storage and Servers
For the fiscal years ended October 31
2009 2008 2007
In millions
Net revenue ........................................... $15,359 $19,400 $18,639
Earnings from operations ................................. $ 1,518 $ 2,577 $ 2,148
Earnings from operations as a % of net revenue ................ 9.9% 13.3% 11.5%
The components of the weighted net revenue change as compared to prior-year periods by
business unit were as follows for the following fiscal years ended October 31:
2009 2008
Percentage Points
Industry standard servers ......................................... (12.1) 1.5
Business critical systems .......................................... (4.9) (0.1)
Storage ...................................................... (3.8) 2.7
Total ESS .................................................... (20.8) 4.1
ESS net revenue decreased 20.8% (16.0% when adjusted for currency) in fiscal 2009 from fiscal
2008. The revenue decline was due primarily to the economic slowdown and overall weak demand
environment. ISS net revenue declined 20% in fiscal 2009 as compared to fiscal 2008 due to declines in
unit volume. ISS average unit prices declined in fiscal 2009 while improving in the second half of fiscal
2009 as a result of a new product ramp up. Total ESS blades revenue declined by 8% in fiscal 2009 as
compared to fiscal 2008. Business critical systems net revenue decreased 27% in fiscal 2009 compared
to fiscal 2008 driven by a decline in Integrity server revenue due to weaker market conditions and by
the planned phase-out of the PA-RISC and Alpha Server product lines. Storage net revenue declined
17% in fiscal 2009 compared to fiscal 2008 due to a decline in disk and tape products as a result of a
59