HP 2006 Annual Report Download - page 97
Download and view the complete annual report
Please find page 97 of the 2006 HP annual report below. You can navigate through the pages in the report by either clicking on the pages listed below, or by using the keyword search tool below to find specific information within the annual report.-
 1
1 -
2
-
3
-
4
-
5
-
6
-
7
-
8
-
9
-
10
-
11
-
12
-
13
-
14
-
15
-
16
-
17
-
18
-
19
-
20
-
21
-
22
-
23
-
24
-
25
-
26
-
27
-
28
-
29
-
30
-
31
-
32
-
33
-
34
-
35
-
36
-
37
-
38
-
39
-
40
-
41
-
42
-
43
-
44
-
45
-
46
-
47
-
48
-
49
-
50
-
51
-
52
-
53
-
54
-
55
-
56
-
57
-
58
-
59
-
60
-
61
-
62
-
63
-
64
-
65
-
66
-
67
-
68
-
69
-
70
-
71
-
72
-
73
-
74
-
75
-
76
-
77
-
78
-
79
-
80
-
81
-
82
-
83
-
84
-
85
-
86
-
 87
87 -
 88
88 -
 89
89 -
 90
90 -
 91
91 -
 92
92 -
 93
93 -
 94
94 -
 95
95 -
 96
96 -
 97
97 -
 98
98 -
 99
99 -
 100
100 -
 101
101 -
 102
102 -
 103
103 -
 104
104 -
 105
105 -
 106
106 -
 107
107 -
108
-
109
-
110
-
111
-
112
-
113
-
114
-
115
-
116
-
117
-
118
-
119
-
120
-
121
-
122
-
123
-
124
-
125
-
126
-
127
-
128
-
129
-
130
-
131
-
132
-
133
-
134
-
135
-
136
-
137
-
138
-
139
-
140
-
141
-
142
-
143
-
144
-
145
-
146
-
147
-
148
-
149
-
150
-
151
-
152
-
153
-
154
-
155
-
156
-
157
-
158
-
159
-
160
-
161
-
162
-
163
-
164
-
165
-
166
-
167
-
168
 |
 |

HEWLETT-PACKARD COMPANY AND SUBSIDIARIES
Notes to Consolidated Financial Statements (Continued)
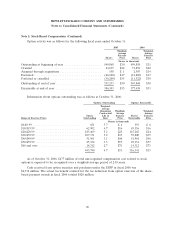
Note 3: Net Earnings Per Share (‘‘EPS’’) (Continued)
48 million options in fiscal 2006, whose combined exercise price, unamortized fair value and excess tax
benefit were greater than the average market price for HP’s common stock as these shares were also
anti-dilutive. In addition, HP excluded approximately 8 million shares of HP stock issuable upon the
assumed conversion of zero-coupon subordinated notes from the calculation of diluted EPS in fiscal
2005 because the effect was antidilutive.
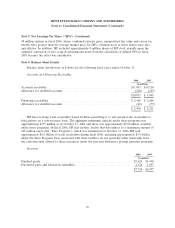
Note 4: Balance Sheet Details
Balance sheet details were as follows for the following fiscal years ended October 31:
Accounts and Financing Receivables
2006 2005
In millions
Accounts receivable ............................................... $11,093 $10,130
Allowance for doubtful accounts ..................................... (220) (227)
$10,873 $ 9,903
Financing receivables ............................................. $ 2,480 $ 2,608
Allowance for doubtful accounts ..................................... (40) (57)
$ 2,440 $ 2,551
HP has revolving trade receivables based facilities permitting it to sell certain trade receivables to
third parties on a non-recourse basis. The aggregate maximum capacity under these programs was
approximately $477 million as of October 31, 2006 and there was approximately $150 million available
under these programs. In fiscal 2006, HP had another facility that was subject to a maximum amount of
525 million euros (the ‘‘Euro Program’’), which was terminated on October 31, 2006. HP sold
approximately $8.6 billion of trade receivables during fiscal 2006, including approximately $5.9 billion
under the Euro Program. Fees associated with these facilities do not generally differ materially from
the cash discounts offered to these customers under the previous alternative prompt payment programs.
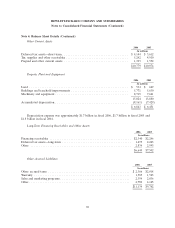
Inventory
2006 2005
In millions
Finished goods .................................................... $5,424 $4,940
Purchased parts and fabricated assemblies ................................ 2,326 1,937
$7,750 $6,877
93