HP 2006 Annual Report Download - page 58
Download and view the complete annual report
Please find page 58 of the 2006 HP annual report below. You can navigate through the pages in the report by either clicking on the pages listed below, or by using the keyword search tool below to find specific information within the annual report.-
 1
1 -
2
-
3
-
4
-
5
-
6
-
7
-
8
-
9
-
10
-
11
-
12
-
13
-
14
-
15
-
16
-
17
-
18
-
19
-
20
-
21
-
22
-
23
-
24
-
25
-
26
-
27
-
28
-
29
-
30
-
31
-
32
-
33
-
34
-
35
-
36
-
37
-
38
-
39
-
40
-
41
-
42
-
43
-
44
-
45
-
46
-
47
-
 48
48 -
 49
49 -
 50
50 -
 51
51 -
 52
52 -
 53
53 -
 54
54 -
 55
55 -
 56
56 -
 57
57 -
 58
58 -
 59
59 -
 60
60 -
 61
61 -
 62
62 -
 63
63 -
 64
64 -
 65
65 -
 66
66 -
 67
67 -
 68
68 -
69
-
70
-
71
-
72
-
73
-
74
-
75
-
76
-
77
-
78
-
79
-
80
-
81
-
82
-
83
-
84
-
85
-
86
-
87
-
88
-
89
-
90
-
91
-
92
-
93
-
94
-
95
-
96
-
97
-
98
-
99
-
100
-
101
-
102
-
103
-
104
-
105
-
106
-
107
-
108
-
109
-
110
-
111
-
112
-
113
-
114
-
115
-
116
-
117
-
118
-
119
-
120
-
121
-
122
-
123
-
124
-
125
-
126
-
127
-
128
-
129
-
130
-
131
-
132
-
133
-
134
-
135
-
136
-
137
-
138
-
139
-
140
-
141
-
142
-
143
-
144
-
145
-
146
-
147
-
148
-
149
-
150
-
151
-
152
-
153
-
154
-
155
-
156
-
157
-
158
-
159
-
160
-
161
-
162
-
163
-
164
-
165
-
166
-
167
-
168
 |
 |

HEWLETT-PACKARD COMPANY AND SUBSIDIARIES
Management’s Discussion and Analysis of
Financial Condition and Results of Operations (Continued)
proprietary support to lower margin areas such as multi-vendor integrated support and network
environmental services. Managed services gross margin increased due to improvements in delivery cost
management across the installed base. Consulting and integration gross margin improved due to higher
revenues and continued operational improvement in presales and delivery cost management.
In fiscal 2005, reductions and efficiencies in our operating expense structure contributed to the
decline in operating expenses as a percentage of net revenue, despite $11 million in workforce
reduction costs in the first half of the fiscal year and the impact of the employee bonuses granted in
the second half of the fiscal year.
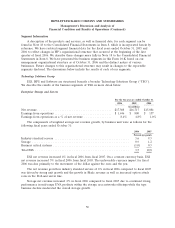
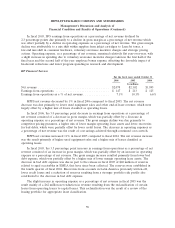
Software
For the fiscal years ended October 31
2006 2005 2004
In millions
Net revenue ......................................... $1,301 $1,061 $ 923
Earnings (loss) from operations ........................... $ 85 $ (49) $(152)
Earnings (loss) from operations as a % of net revenue .......... 6.5% (4.6)% (16.5)%
In fiscal 2006, Software net revenue increased 23% (8% excluding the impact of acquisitions and
24% on a constant currency basis) from fiscal 2005. The unfavorable currency impact was due primarily
to the movement of the dollar against the euro and the yen for fiscal 2006. Peregrine, which was
acquired in December 2005, represented 14.7 percentage points of Software’s net revenue growth for
fiscal 2006. Net revenue associated with the Peregrine acquisition is included in the results of
OpenView, our management solutions software product line, which represented 20 percentage points of
growth on a weighted average net revenue basis for fiscal 2006. OpenCall, our telecommunications
solutions product line, contributed the remaining 3 percentage points of the weighted average net
revenue increase for fiscal 2006. OpenView net revenue growth was the result of acquisitions and
increases in support and services contracts. OpenCall net revenue growth was the result of increased
product sales and licenses as well as larger contracts.
The operating margin improvement for fiscal 2006 of 11.1 percentage points as compared to fiscal
2005 was the result primarily of a decrease in operating expense as a percentage of net revenue and an
increase in gross margin. The decrease in operating expense as a percentage of net revenue was
attributable to growth in field selling costs, research and development and marketing expenses
attributable to cost management efforts that was slower than revenue growth. These cost reductions
were partially offset by high integration costs associated with the acquisition of Peregrine as well as
higher bonus accruals. The improvement in gross margin was driven by an increase in revenue, more
effective management of the support and services costs for OpenView and OpenCall and from
improved margins of our OpenCall product line resulting from a favorable product mix shift towards
higher margin products.
In fiscal 2005, Software net revenue increased 15% (12% without acquisitions) from fiscal 2004
and 13% on a constant currency basis. The favorable currency impact was due primarily to the
weakening of the dollar against the euro and the yen for the first three quarters of fiscal 2005 and to a
lesser extent in the fourth fiscal quarter as the dollar strengthened against the euro and the yen during
that period. OpenView represented 12 percentage points of net revenue growth on a weighted average
basis for fiscal 2005. OpenCall represented 3 percentage points of growth on a weighted average net
revenue basis for fiscal 2005. OpenView net revenue growth was the result of increases in larger
54