HP 2006 Annual Report Download - page 142
Download and view the complete annual report
Please find page 142 of the 2006 HP annual report below. You can navigate through the pages in the report by either clicking on the pages listed below, or by using the keyword search tool below to find specific information within the annual report.-
 1
1 -
2
-
3
-
4
-
5
-
6
-
7
-
8
-
9
-
10
-
11
-
12
-
13
-
14
-
15
-
16
-
17
-
18
-
19
-
20
-
21
-
22
-
23
-
24
-
25
-
26
-
27
-
28
-
29
-
30
-
31
-
32
-
33
-
34
-
35
-
36
-
37
-
38
-
39
-
40
-
41
-
42
-
43
-
44
-
45
-
46
-
47
-
48
-
49
-
50
-
51
-
52
-
53
-
54
-
55
-
56
-
57
-
58
-
59
-
60
-
61
-
62
-
63
-
64
-
65
-
66
-
67
-
68
-
69
-
70
-
71
-
72
-
73
-
74
-
75
-
76
-
77
-
78
-
79
-
80
-
81
-
82
-
83
-
84
-
85
-
86
-
87
-
88
-
89
-
90
-
91
-
92
-
93
-
94
-
95
-
96
-
97
-
98
-
99
-
100
-
101
-
102
-
103
-
104
-
105
-
106
-
107
-
108
-
109
-
110
-
111
-
112
-
113
-
114
-
115
-
116
-
117
-
118
-
119
-
120
-
121
-
122
-
123
-
124
-
125
-
126
-
127
-
128
-
129
-
130
-
131
-
 132
132 -
 133
133 -
 134
134 -
 135
135 -
 136
136 -
 137
137 -
 138
138 -
 139
139 -
 140
140 -
 141
141 -
 142
142 -
 143
143 -
 144
144 -
 145
145 -
 146
146 -
 147
147 -
 148
148 -
 149
149 -
 150
150 -
 151
151 -
 152
152 -
153
-
154
-
155
-
156
-
157
-
158
-
159
-
160
-
161
-
162
-
163
-
164
-
165
-
166
-
167
-
168
 |
 |

HEWLETT-PACKARD COMPANY AND SUBSIDIARIES
Notes to Consolidated Financial Statements (Continued)
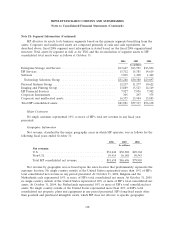
Note 18: Segment Information (Continued)
HP allocates its assets to its business segments based on the primary segments benefiting from the
assets. Corporate and unallocated assets are composed primarily of cash and cash equivalents. As
described above, fiscal 2006 segment asset information is stated based on the fiscal 2006 organizational
structure. Total assets by segment as well as for TSG and the reconciliation of segment assets to HP
consolidated total assets were as follows at October 31:
2006 2005 2004
In millions
Enterprise Storage and Servers ............................... $13,647 $13,591 $13,856
HP Services ............................................. 15,712 15,381 14,619
Software ............................................... 1,909 1,408 1,422
Technology Solutions Group ............................... $31,268 $30,380 $29,897
Personal Systems Group .................................... 12,237 11,277 10,622
Imaging and Printing Group ................................. 13,889 13,523 14,169
HP Financial Services ...................................... 7,927 7,856 7,992
Corporate Investments ..................................... 305 297 375
Corporate and unallocated assets ............................. 16,355 13,984 13,083
Total HP consolidated assets ................................. $81,981 $77,317 $76,138
Major Customers
No single customer represented 10% or more of HP’s total net revenue in any fiscal year
presented.
Geographic Information
Net revenue, classified by the major geographic areas in which HP operates, was as follows for the
following fiscal years ended October 31:
2006 2005 2004
In millions
Net revenue:
U.S. ..................................... $32,244 $30,548 $29,362
Non-U.S. ................................. 59,414 56,148 50,543
Total HP consolidated net revenue ............... $91,658 $86,696 $79,905
Net revenue by geographic area is based upon the sales location that predominately represents the
customer location. No single country outside of the United States represented more than 10% of HP’s
total consolidated net revenue in any period presented. At October 31, 2006, Belgium and the
Netherlands each represented 10% or more of HP’s total consolidated net assets. At October 31, 2005,
no single country outside of the United States represented 10% or more of HP’s total consolidated net
assets. At October 31, 2004, the Netherlands represented 10% or more of HP’s total consolidated net
assets. No single country outside of the United States represented more than 10% of HP’s total
consolidated net property, plant and equipment in any period presented. HP’s long-lived assets other
than goodwill and purchased intangible assets, which HP does not allocate to specific geographic
138