HP 2006 Annual Report Download - page 45
Download and view the complete annual report
Please find page 45 of the 2006 HP annual report below. You can navigate through the pages in the report by either clicking on the pages listed below, or by using the keyword search tool below to find specific information within the annual report.-
 1
1 -
2
-
3
-
4
-
5
-
6
-
7
-
8
-
9
-
10
-
11
-
12
-
13
-
14
-
15
-
16
-
17
-
18
-
19
-
20
-
21
-
22
-
23
-
24
-
25
-
26
-
27
-
28
-
29
-
30
-
31
-
32
-
33
-
34
-
 35
35 -
 36
36 -
 37
37 -
 38
38 -
 39
39 -
 40
40 -
 41
41 -
 42
42 -
 43
43 -
 44
44 -
 45
45 -
 46
46 -
 47
47 -
 48
48 -
 49
49 -
 50
50 -
 51
51 -
 52
52 -
 53
53 -
 54
54 -
 55
55 -
56
-
57
-
58
-
59
-
60
-
61
-
62
-
63
-
64
-
65
-
66
-
67
-
68
-
69
-
70
-
71
-
72
-
73
-
74
-
75
-
76
-
77
-
78
-
79
-
80
-
81
-
82
-
83
-
84
-
85
-
86
-
87
-
88
-
89
-
90
-
91
-
92
-
93
-
94
-
95
-
96
-
97
-
98
-
99
-
100
-
101
-
102
-
103
-
104
-
105
-
106
-
107
-
108
-
109
-
110
-
111
-
112
-
113
-
114
-
115
-
116
-
117
-
118
-
119
-
120
-
121
-
122
-
123
-
124
-
125
-
126
-
127
-
128
-
129
-
130
-
131
-
132
-
133
-
134
-
135
-
136
-
137
-
138
-
139
-
140
-
141
-
142
-
143
-
144
-
145
-
146
-
147
-
148
-
149
-
150
-
151
-
152
-
153
-
154
-
155
-
156
-
157
-
158
-
159
-
160
-
161
-
162
-
163
-
164
-
165
-
166
-
167
-
168
 |
 |
HEWLETT-PACKARD COMPANY AND SUBSIDIARIES
Management’s Discussion and Analysis of
Financial Condition and Results of Operations (Continued)
future results may differ from those estimates. In addition, we make certain judgments and assumptions
in allocating shared assets and liabilities to determine the carrying values for each of our reporting
units.
Our annual goodwill impairment analysis, which we performed during the fourth quarter of fiscal
2006, did not result in an impairment charge. The excess of fair value over carrying value for each of
HP’s reporting units as of August 1, 2006, the annual testing date, ranged from approximately
$350 million to approximately $41.4 billion. In order to evaluate the sensitivity of the fair value
calculations on the goodwill impairment test, we applied a hypothetical 10% decrease to the fair values
of each reporting unit. This hypothetical 10% decrease would result in excess fair value over carrying
value ranging from approximately $200 million to approximately $36.6 billion for each of HP’s
reporting units.
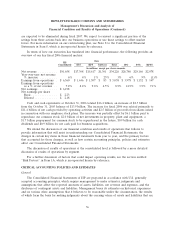
Warranty Provision
We provide for the estimated cost of product warranties at the time we recognize revenue. We
evaluate our warranty obligations on a product group basis. Our standard product warranty terms
generally include post-sales support and repairs or replacement of a product at no additional charge for
a specified period of time. While we engage in extensive product quality programs and processes,
including actively monitoring and evaluating the quality of our component suppliers, we base our
estimated warranty obligation upon warranty terms, ongoing product failure rates, repair costs, product
call rates, average cost per call, and current period product shipments. If actual product failure rates,
repair rates, service delivery costs or post-sales support costs differ from our estimates, we would be
required to make revisions to the estimated warranty liability. Warranty terms generally range from
90 days parts-only to three years parts and labor, depending upon the product. Over the last three
fiscal years, the annual warranty provision has averaged approximately 3.6% of annual net product
revenue, while actual annual warranty costs have averaged approximately 3.4% of annual net product
revenue.
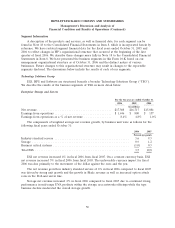
Retirement Benefits
Our pension and other post-retirement benefit costs and obligations are dependent on various
assumptions. Our major assumptions relate primarily to discount rates, salary growth, long-term return
on plan assets and medical cost trend rates. We base the discount rate assumption on current
investment yields of high quality fixed income investments during the retirement benefits maturity
period. The salary growth assumptions reflect our long-term actual experience and future and
near-term outlook. Long-term return on plan assets is determined based on historical portfolio results
and management’s expectation of the future economic environment, as well as target asset allocations.
Our medical cost trend assumptions are developed based on historical cost data, the near-term outlook
and an assessment of likely long-term trends. Actual results that differ from our assumptions are
accumulated and are amortized generally over the estimated future working life of the plan
participants.
Our major assumptions vary by plan and the weighted average rates used are set forth in Note 15
to the Consolidated Financial Statements in Item 8, which is incorporated herein by reference. Each
assumption has different sensitivity characteristics, and, in general, changes, if any, have moved in the
41