HP 2006 Annual Report Download - page 47
Download and view the complete annual report
Please find page 47 of the 2006 HP annual report below. You can navigate through the pages in the report by either clicking on the pages listed below, or by using the keyword search tool below to find specific information within the annual report.-
 1
1 -
2
-
3
-
4
-
5
-
6
-
7
-
8
-
9
-
10
-
11
-
12
-
13
-
14
-
15
-
16
-
17
-
18
-
19
-
20
-
21
-
22
-
23
-
24
-
25
-
26
-
27
-
28
-
29
-
30
-
31
-
32
-
33
-
34
-
35
-
36
-
 37
37 -
 38
38 -
 39
39 -
 40
40 -
 41
41 -
 42
42 -
 43
43 -
 44
44 -
 45
45 -
 46
46 -
 47
47 -
 48
48 -
 49
49 -
 50
50 -
 51
51 -
 52
52 -
 53
53 -
 54
54 -
 55
55 -
 56
56 -
 57
57 -
58
-
59
-
60
-
61
-
62
-
63
-
64
-
65
-
66
-
67
-
68
-
69
-
70
-
71
-
72
-
73
-
74
-
75
-
76
-
77
-
78
-
79
-
80
-
81
-
82
-
83
-
84
-
85
-
86
-
87
-
88
-
89
-
90
-
91
-
92
-
93
-
94
-
95
-
96
-
97
-
98
-
99
-
100
-
101
-
102
-
103
-
104
-
105
-
106
-
107
-
108
-
109
-
110
-
111
-
112
-
113
-
114
-
115
-
116
-
117
-
118
-
119
-
120
-
121
-
122
-
123
-
124
-
125
-
126
-
127
-
128
-
129
-
130
-
131
-
132
-
133
-
134
-
135
-
136
-
137
-
138
-
139
-
140
-
141
-
142
-
143
-
144
-
145
-
146
-
147
-
148
-
149
-
150
-
151
-
152
-
153
-
154
-
155
-
156
-
157
-
158
-
159
-
160
-
161
-
162
-
163
-
164
-
165
-
166
-
167
-
168
 |
 |

HEWLETT-PACKARD COMPANY AND SUBSIDIARIES
Management’s Discussion and Analysis of
Financial Condition and Results of Operations (Continued)
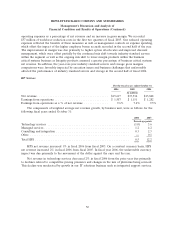
Net Revenue
The components of weighted average net revenue growth were as follows for the following fiscal
years ended October 31:
2006 2005
Percentage points
Personal Systems Group .............................................. 2.8 2.7
Imaging and Printing Group ........................................... 1.9 1.2
Enterprise Storage and Servers ......................................... 0.7 2.0
Software ......................................................... 0.3 0.2
HP Services ....................................................... 0.1 2.1
HP Financial Services ................................................ (0.1) 0.3
Corporate Investments/Other .......................................... — —
Total HP ......................................................... 5.7 8.5
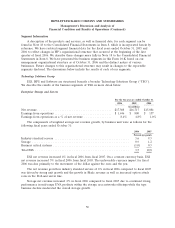
In fiscal 2006, HP net revenue increased approximately 6% from the prior year period (7% on a
constant currency basis). The unfavorable currency impact for fiscal 2006 was due primarily to the
movement of the dollar against the euro and the yen. U.S. net revenue was $32.2 billion for fiscal 2006,
an increase of 6% from the prior year, while international net revenue increased 6% to $59.4 billion.
PSG net revenue increased across all regions as a result of a 15% volume increase. The volume
increase resulted from strong growth in consumer and commercial markets and significant improvement
in emerging markets, which was partially offset by 6% and 7% declines in average selling prices
(‘‘ASPs’’) in consumer and commercial clients, respectively. IPG net revenue growth in fiscal 2006 was
due mainly to increased shipment volumes of printer supplies resulting from the continued expansion of
printer hardware placements and the strong performance of color-related products. ESS net revenue
growth was the result primarily of strong unit growth in our industry standard servers business (‘‘ISS’’),
Blade revenue growth, increased option attach rates in our ProLiant server line, continued strong
performance in mid-range EVA products within our Storage business and revenue increases from our
Integrity servers. The ESS growth was moderated by revenue declines in our tape business and
PA-RISC and Alpha Server product lines. The net revenue growth in Software for fiscal 2006 was due
primarily to growth in our OpenView business as a result of the Peregrine acquisition and an increase
in support and service contracts. HPS net revenue increased in fiscal 2006 due primarily to revenue
increases in management services driven by new business and existing account growth, which were
offset by declines in the technology services business resulting from competitive pricing pressures and
changes in the mix of platforms being serviced. The HPFS net revenue decline in fiscal 2006 was due
primarily to lower used equipment sales.
In fiscal 2005, HP net revenue increased approximately 8% from the prior year period (6% on a
constant currency basis). The favorable currency impact was due primarily to the weakening of the
dollar against the euro and the yen for the first three quarters of fiscal 2005 and to a lesser extent in
the fourth fiscal quarter as the dollar strengthened against the euro and the yen during that period.
U.S. net revenue was $30.5 billion for fiscal 2005, an increase of 4% from the prior year, while
international net revenue increased 11% to $56.2 billion.
In PSG, net revenue increased across all regions as a result of a 13% volume increase in consumer
and commercial clients. The volume increase was partially offset by a decline of 4% in ASPs. Notebook
43