HP 2006 Annual Report Download - page 61
Download and view the complete annual report
Please find page 61 of the 2006 HP annual report below. You can navigate through the pages in the report by either clicking on the pages listed below, or by using the keyword search tool below to find specific information within the annual report.-
 1
1 -
2
-
3
-
4
-
5
-
6
-
7
-
8
-
9
-
10
-
11
-
12
-
13
-
14
-
15
-
16
-
17
-
18
-
19
-
20
-
21
-
22
-
23
-
24
-
25
-
26
-
27
-
28
-
29
-
30
-
31
-
32
-
33
-
34
-
35
-
36
-
37
-
38
-
39
-
40
-
41
-
42
-
43
-
44
-
45
-
46
-
47
-
48
-
49
-
50
-
 51
51 -
 52
52 -
 53
53 -
 54
54 -
 55
55 -
 56
56 -
 57
57 -
 58
58 -
 59
59 -
 60
60 -
 61
61 -
 62
62 -
 63
63 -
 64
64 -
 65
65 -
 66
66 -
 67
67 -
 68
68 -
 69
69 -
 70
70 -
 71
71 -
72
-
73
-
74
-
75
-
76
-
77
-
78
-
79
-
80
-
81
-
82
-
83
-
84
-
85
-
86
-
87
-
88
-
89
-
90
-
91
-
92
-
93
-
94
-
95
-
96
-
97
-
98
-
99
-
100
-
101
-
102
-
103
-
104
-
105
-
106
-
107
-
108
-
109
-
110
-
111
-
112
-
113
-
114
-
115
-
116
-
117
-
118
-
119
-
120
-
121
-
122
-
123
-
124
-
125
-
126
-
127
-
128
-
129
-
130
-
131
-
132
-
133
-
134
-
135
-
136
-
137
-
138
-
139
-
140
-
141
-
142
-
143
-
144
-
145
-
146
-
147
-
148
-
149
-
150
-
151
-
152
-
153
-
154
-
155
-
156
-
157
-
158
-
159
-
160
-
161
-
162
-
163
-
164
-
165
-
166
-
167
-
168
 |
 |

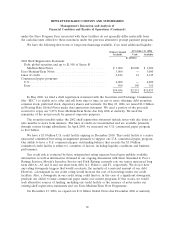
HEWLETT-PACKARD COMPANY AND SUBSIDIARIES
Management’s Discussion and Analysis of
Financial Condition and Results of Operations (Continued)
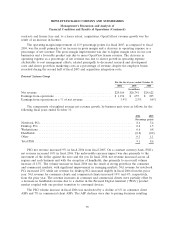
The components of weighted average net revenue growth, by business unit were as follows for the
following fiscal years ended October 31:
2006 2005
Percentage points
Supplies ......................................................... 5.4 3.3
Commercial hardware ............................................... 1.4 1.6
Consumer hardware ................................................. (0.3) (0.8)
Other ........................................................... — (0.1)
Total IPG ........................................................ 6.5 4.0
IPG net revenue increased 6% in fiscal 2006 from fiscal 2005. On a constant currency basis, the
net revenue increase was 7% in fiscal 2006. The unfavorable currency impact was due primarily to the
movement of the dollar against the euro and the yen for fiscal 2006.
In fiscal 2006, the growth in printer supplies net revenue reflected higher unit volumes as a result
of the continued expansion of printer hardware placements and the strong performance of color-related
products. The growth in commercial hardware net revenue in fiscal 2006 was attributable mainly to unit
volume growth in color laser printers and multifunction printers and, to a lesser extent, revenue from
our large format printing products with the acquisition of Scitex on November 1, 2005. Both
commercial and consumer hardware were impacted by the continued shift in demand to lower-priced
products and strategic pricing decisions which caused average revenue per unit to decline.
In fiscal 2006, IPG earnings from operations as a percentage of net revenue increased
1.3 percentage points as compared to fiscal 2005, which was the result primarily of an increase in gross
margin and a decrease in operating expense as a percentage of net revenue. The gross margin increase
was due primarily to improved margins for supplies due to product mix and a favorable portfolio mix
shift from hardware to supplies, which was partially offset by unfavorable consumer hardware margins.
Operating expense as a percentage of net revenue for fiscal 2006 declined, due mainly to realized
savings from our cost structure initiatives coupled with increased revenue and partially offset by higher
bonus accruals.
IPG net revenue increased 4% in fiscal 2005 from fiscal 2004. On a constant currency basis, the
net revenue increase was 2% in fiscal 2005. The favorable currency impact was due primarily to the
weakening of the dollar against the euro and the yen for the first three quarters of fiscal 2005 and to a
lesser extent in the fourth fiscal quarter as the dollar strengthened against the euro and the yen during
that period.
In fiscal 2005, the growth in supplies net revenue was attributable primarily to unit growth in
LaserJet toner, due primarily to increased sales of color-related products. The growth in commercial
hardware net revenue in fiscal 2005 was attributable to unit volume growth in color LaserJet printers,
multifunction printers and the digital press business. New product introductions added to the net
revenue growth in multifunction printers. The effect of the commercial hardware volume increase was
offset partially by decreasing ASPs. In fiscal 2005, consumer hardware net revenue decreased. This
decline was the result of continuing decreases in ASPs due to strategic pricing actions, the continued
mix shift in demand to lower-priced products, intense competition in both the all-in-one and single
function inkjet printers and the ongoing decline in the scanner market.
57