HP 2006 Annual Report Download - page 64
Download and view the complete annual report
Please find page 64 of the 2006 HP annual report below. You can navigate through the pages in the report by either clicking on the pages listed below, or by using the keyword search tool below to find specific information within the annual report.-
 1
1 -
2
-
3
-
4
-
5
-
6
-
7
-
8
-
9
-
10
-
11
-
12
-
13
-
14
-
15
-
16
-
17
-
18
-
19
-
20
-
21
-
22
-
23
-
24
-
25
-
26
-
27
-
28
-
29
-
30
-
31
-
32
-
33
-
34
-
35
-
36
-
37
-
38
-
39
-
40
-
41
-
42
-
43
-
44
-
45
-
46
-
47
-
48
-
49
-
50
-
51
-
52
-
53
-
 54
54 -
 55
55 -
 56
56 -
 57
57 -
 58
58 -
 59
59 -
 60
60 -
 61
61 -
 62
62 -
 63
63 -
 64
64 -
 65
65 -
 66
66 -
 67
67 -
 68
68 -
 69
69 -
 70
70 -
 71
71 -
 72
72 -
 73
73 -
 74
74 -
75
-
76
-
77
-
78
-
79
-
80
-
81
-
82
-
83
-
84
-
85
-
86
-
87
-
88
-
89
-
90
-
91
-
92
-
93
-
94
-
95
-
96
-
97
-
98
-
99
-
100
-
101
-
102
-
103
-
104
-
105
-
106
-
107
-
108
-
109
-
110
-
111
-
112
-
113
-
114
-
115
-
116
-
117
-
118
-
119
-
120
-
121
-
122
-
123
-
124
-
125
-
126
-
127
-
128
-
129
-
130
-
131
-
132
-
133
-
134
-
135
-
136
-
137
-
138
-
139
-
140
-
141
-
142
-
143
-
144
-
145
-
146
-
147
-
148
-
149
-
150
-
151
-
152
-
153
-
154
-
155
-
156
-
157
-
158
-
159
-
160
-
161
-
162
-
163
-
164
-
165
-
166
-
167
-
168
 |
 |

HEWLETT-PACKARD COMPANY AND SUBSIDIARIES
Management’s Discussion and Analysis of
Financial Condition and Results of Operations (Continued)
Portfolio assets at October 31, 2006 increased 4% from October 31, 2005. The increase resulted
from a favorable currency impact and a high level of financing originations in the fourth quarter. The
overall percentage of portfolio assets reserved decreased due primarily to the write-off of assets
covered by specific reserves and lower reserves resulting from a stronger portfolio risk profile.
HPFS funds its operations mainly through a combination of intercompany debt and equity. The
increase in the debt to equity ratio reflects a planned increase in portfolio leverage.
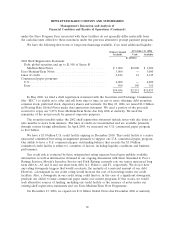
Corporate Investments
For the fiscal years ended October 31
2006 2005 2004
In millions
Net revenue .......................................... $ 566 $ 523 $ 449
Loss from operations ................................... $(151) $ (174) $ (179)
Loss from operations as a % of net revenue ................... (26.7)% (33.3)% (39.9)%
In fiscal 2006, the majority of the net revenue in Corporate Investments related to network
infrastructure products, which grew 8% as a result of continued increased sales of gigabit Ethernet
switch products.
Corporate Investments’ loss from operations in fiscal 2006 decreased compared to fiscal 2005 due
primarily to lower operating expenses related to global alliances and HP Labs and higher gross profits
from network infrastructure products. The decrease in operating expenses was due primarily to savings
resulting from restructuring actions and lower program spending. Expenses related to global alliances
and HP Labs contributed to the majority of the loss from operations. Such loss was offset in part by
operating profit from network infrastructure product sales.
In fiscal 2005, the majority of the net revenue in Corporate Investments related to network
infrastructure products, which increased 20% from fiscal 2004 as a result of continued product
enhancements, particularly in gigabit Ethernet switch products.
Expenses related to corporate development, global alliances and HP Labs increased 5% in fiscal
2005 from fiscal 2004. The increase was due to higher spending on strategic initiatives and incubation
programs. These expenses, which contributed to the majority of the loss from operations for Corporate
Investments, were offset in part by operating profit from network infrastructure product sales.
Corporate Investment’s loss from operations for fiscal 2005 decreased slightly from the prior fiscal year
due to an increase in operating profit in network infrastructure products as a result of increasing
operating margins, offset partially by an increase in operating expenses related to corporate
development, global alliances and HP Labs. The increase in gross margin was due primarily to a
favorable product mix and lower trade discounts as a percentage of net revenue for network
infrastructure products.
LIQUIDITY AND CAPITAL RESOURCES
Our cash balances are held in numerous locations throughout the world, including substantial
amounts held outside of the United States. Most of the amounts held outside of the United States
could be repatriated to the United States but, under current law, would be subject to United States
federal income taxes, less applicable foreign tax credits. Repatriation of some foreign balances is
restricted by local laws. HP has provided for the United States federal tax liability on these amounts for
60