HP 2006 Annual Report Download - page 65
Download and view the complete annual report
Please find page 65 of the 2006 HP annual report below. You can navigate through the pages in the report by either clicking on the pages listed below, or by using the keyword search tool below to find specific information within the annual report.-
 1
1 -
2
-
3
-
4
-
5
-
6
-
7
-
8
-
9
-
10
-
11
-
12
-
13
-
14
-
15
-
16
-
17
-
18
-
19
-
20
-
21
-
22
-
23
-
24
-
25
-
26
-
27
-
28
-
29
-
30
-
31
-
32
-
33
-
34
-
35
-
36
-
37
-
38
-
39
-
40
-
41
-
42
-
43
-
44
-
45
-
46
-
47
-
48
-
49
-
50
-
51
-
52
-
53
-
54
-
 55
55 -
 56
56 -
 57
57 -
 58
58 -
 59
59 -
 60
60 -
 61
61 -
 62
62 -
 63
63 -
 64
64 -
 65
65 -
 66
66 -
 67
67 -
 68
68 -
 69
69 -
 70
70 -
 71
71 -
 72
72 -
 73
73 -
 74
74 -
 75
75 -
76
-
77
-
78
-
79
-
80
-
81
-
82
-
83
-
84
-
85
-
86
-
87
-
88
-
89
-
90
-
91
-
92
-
93
-
94
-
95
-
96
-
97
-
98
-
99
-
100
-
101
-
102
-
103
-
104
-
105
-
106
-
107
-
108
-
109
-
110
-
111
-
112
-
113
-
114
-
115
-
116
-
117
-
118
-
119
-
120
-
121
-
122
-
123
-
124
-
125
-
126
-
127
-
128
-
129
-
130
-
131
-
132
-
133
-
134
-
135
-
136
-
137
-
138
-
139
-
140
-
141
-
142
-
143
-
144
-
145
-
146
-
147
-
148
-
149
-
150
-
151
-
152
-
153
-
154
-
155
-
156
-
157
-
158
-
159
-
160
-
161
-
162
-
163
-
164
-
165
-
166
-
167
-
168
 |
 |

HEWLETT-PACKARD COMPANY AND SUBSIDIARIES
Management’s Discussion and Analysis of
Financial Condition and Results of Operations (Continued)
financial statement purposes except for foreign earnings that are considered indefinitely reinvested
outside of the United States. Repatriation could result in additional United States federal income tax
payments in future years. Where local restrictions prevent an efficient intercompany transfer of funds,
our intent is that cash balances would remain outside of the United States and we would meet United
States liquidity needs through ongoing cash flows, external borrowings, or both. We utilize a variety of
tax planning and financing strategies in an effort to ensure that our worldwide cash is available in the
locations in which it is needed.
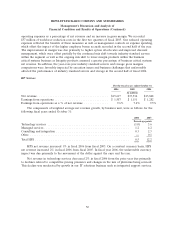
FINANCIAL CONDITION (Sources and Uses of Cash)
Our total cash and cash equivalents increased approximately 18% to $16.4 billion at October 31,
2006 from $13.9 billion at the end of fiscal 2005. Net earnings in fiscal 2006 helped generate
$11.4 billion in cash from operating activities. The cash generated by operations in fiscal 2006 funded
all of the $8.9 billion in investing and financing activities. Year-over-year outstanding debt was flat at
$5.2 billion at October 31, 2006. The net $8.9 billion used for investing and financing activities during
fiscal 2006 included $6.1 billion for share repurchases, $2.0 billion for net investments in property, plant
and equipment, $1.7 billion for prepayment for common stock to be repurchased in future periods,
$0.9 billion for cash dividends and $0.9 billion for cash payments on acquisitions. Cash flows from
financing activities benefited from $2.5 billion of proceeds relating to employee stock plans. Our cash
position remains strong and our cash balances are sufficient to cover significant cash outlays expected
in fiscal 2007 associated with our acquisitions, restructuring actions and company bonus payments.
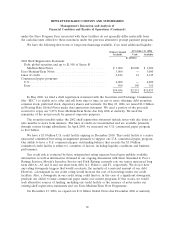
For the fiscal years ended October 31
2006 2005 2004
In millions
Net cash provided by operating activities .................... $11,353 $ 8,028 $ 5,088
Net cash used in investing activities ........................ (2,787) (1,757) (2,454)
Net cash used in financing activities ........................ (6,077) (5,023) (4,159)
Net increase (decrease) in cash and cash equivalents ............ $ 2,489 $ 1,248 $(1,525)
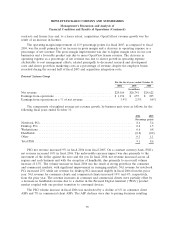
Key Performance Metrics
October 31
2006 2005 2004
Days of sales outstanding in accounts receivable ........................... 40 39 43
Days of supply in inventory .......................................... 38 35 39
Days of purchases outstanding in accounts payable ......................... (59) (52) (51)
Cash conversion cycle .............................................. 19 22 31
Days of sales outstanding in accounts receivable (‘‘DSO’’) measures the average number of days
our receivables are outstanding. DSO is calculated by dividing accounts receivable, net of allowance for
doubtful accounts, by a 90-day average net revenue.
Days of supply in inventory (‘‘DOS’’) measures the average number of days from procurement to
sale of our product. DOS is calculated by dividing inventory by a 90-day average cost of goods sold.
61