HP 2006 Annual Report Download - page 49
Download and view the complete annual report
Please find page 49 of the 2006 HP annual report below. You can navigate through the pages in the report by either clicking on the pages listed below, or by using the keyword search tool below to find specific information within the annual report.-
 1
1 -
2
-
3
-
4
-
5
-
6
-
7
-
8
-
9
-
10
-
11
-
12
-
13
-
14
-
15
-
16
-
17
-
18
-
19
-
20
-
21
-
22
-
23
-
24
-
25
-
26
-
27
-
28
-
29
-
30
-
31
-
32
-
33
-
34
-
35
-
36
-
37
-
38
-
 39
39 -
 40
40 -
 41
41 -
 42
42 -
 43
43 -
 44
44 -
 45
45 -
 46
46 -
 47
47 -
 48
48 -
 49
49 -
 50
50 -
 51
51 -
 52
52 -
 53
53 -
 54
54 -
 55
55 -
 56
56 -
 57
57 -
 58
58 -
 59
59 -
60
-
61
-
62
-
63
-
64
-
65
-
66
-
67
-
68
-
69
-
70
-
71
-
72
-
73
-
74
-
75
-
76
-
77
-
78
-
79
-
80
-
81
-
82
-
83
-
84
-
85
-
86
-
87
-
88
-
89
-
90
-
91
-
92
-
93
-
94
-
95
-
96
-
97
-
98
-
99
-
100
-
101
-
102
-
103
-
104
-
105
-
106
-
107
-
108
-
109
-
110
-
111
-
112
-
113
-
114
-
115
-
116
-
117
-
118
-
119
-
120
-
121
-
122
-
123
-
124
-
125
-
126
-
127
-
128
-
129
-
130
-
131
-
132
-
133
-
134
-
135
-
136
-
137
-
138
-
139
-
140
-
141
-
142
-
143
-
144
-
145
-
146
-
147
-
148
-
149
-
150
-
151
-
152
-
153
-
154
-
155
-
156
-
157
-
158
-
159
-
160
-
161
-
162
-
163
-
164
-
165
-
166
-
167
-
168
 |
 |
HEWLETT-PACKARD COMPANY AND SUBSIDIARIES
Management’s Discussion and Analysis of
Financial Condition and Results of Operations (Continued)
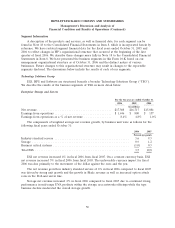
Total company gross margin increased in fiscal 2006 as compared to fiscal 2005. The improvement
in ESS gross margin in fiscal 2006 was due primarily to a favorable unit mix, improved discount
management, and lower component costs. HPS gross margin increase was driven mainly by the
continued focus on cost structure improvement from delivery efficiencies and cost controls, which were
partially offset by the continued competitive environment in the solutions and services business and
higher fiscal 2006 bonus accruals. For IPG, the gross margin increased in fiscal 2006 due primarily to
improved supplies margins and a favorable portfolio mix shift from hardware to supplies, which were
partially offset by unfavorable consumer hardware margins. The improvement in Software gross margin
in fiscal 2006 was due primarily to an increase in revenue and more effective management of the
support and services costs for OpenView and OpenCall. The gross margin improvement in PSG
resulted primarily from reduced warranty expense and supply chain costs as a percentage of revenue
and component cost declines. HPFS gross margin was impacted unfavorably in fiscal 2006 due primarily
to competitor pricing pressures, a higher mix of lower margin operating lease assets and lower
recoveries for bad debts, which were partially offset by lower credit losses in fiscal 2006.
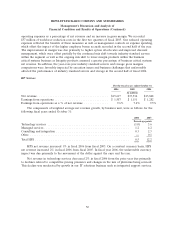
Total company gross margin decreased in fiscal 2005 as compared to fiscal 2004. For IPG, the
gross margin decline in fiscal 2005 was attributable primarily to a mix shift within supplies from inkjet
cartridges to LaserJet toner and continuing decreases in ASPs within hardware due to strategic pricing
actions. The gross margin decline in HPS in fiscal 2005 reflected primarily competitive pricing pressures
and portfolio mix shifts within technology services along with higher employee bonus costs in the
second half of the fiscal year. In fiscal 2005, ESS gross margin increased slightly as the benefits of
improved option attach rates in industry standard servers and improved performance in storage helped
to offset the unfavorable impact from the continued mix shift towards industry standard servers within
the segment and the mix shift to lower margin products within business critical systems. The gross
margin contribution for HPFS and Software increased slightly in fiscal 2005 as lower bad debt expense
increased gross margin in HPFS, while an increase in both OpenView and OpenCall gross margins
benefited the Software business. The gross margin improvement in PSG in fiscal 2005 resulted from
component cost declines, product mix shift towards higher margin notebook PCs and reduced warranty
costs.
Operating Expenses
Research and Development
Total research and development (‘‘R&D’’) expense as a percentage of net revenue decreased
slightly in fiscal 2006 as compared to fiscal 2005 due primarily to revenue growing faster than R&D
expense. R&D expense increased in fiscal 2006 due primarily to higher bonus accruals and stock-based
compensation expense, which were partially offset by expense controls and cost savings from
restructuring actions. As a percentage of net revenue, each of our major segments experienced a
year-over-year decrease in R&D expense in fiscal 2006.
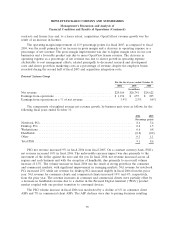
In fiscal 2005, total R&D expense as a percentage of net revenue declined from the same period
in the prior year due primarily to savings resulting from workforce reductions and tight expense
controls. These savings were partially offset by increased costs for the company bonus and costs
associated with the workforce rebalancing actions taken in the first half of the fiscal year. As a
percentage of net revenue, each of our segments experienced a decrease in research and development
expense in fiscal 2005 as we worked to focus our investments and manage realignment, while also
continuing to drive new technologies and business opportunities. Such decreases resulted in part from
45