HP 2006 Annual Report Download - page 48
Download and view the complete annual report
Please find page 48 of the 2006 HP annual report below. You can navigate through the pages in the report by either clicking on the pages listed below, or by using the keyword search tool below to find specific information within the annual report.-
 1
1 -
2
-
3
-
4
-
5
-
6
-
7
-
8
-
9
-
10
-
11
-
12
-
13
-
14
-
15
-
16
-
17
-
18
-
19
-
20
-
21
-
22
-
23
-
24
-
25
-
26
-
27
-
28
-
29
-
30
-
31
-
32
-
33
-
34
-
35
-
36
-
37
-
 38
38 -
 39
39 -
 40
40 -
 41
41 -
 42
42 -
 43
43 -
 44
44 -
 45
45 -
 46
46 -
 47
47 -
 48
48 -
 49
49 -
 50
50 -
 51
51 -
 52
52 -
 53
53 -
 54
54 -
 55
55 -
 56
56 -
 57
57 -
 58
58 -
59
-
60
-
61
-
62
-
63
-
64
-
65
-
66
-
67
-
68
-
69
-
70
-
71
-
72
-
73
-
74
-
75
-
76
-
77
-
78
-
79
-
80
-
81
-
82
-
83
-
84
-
85
-
86
-
87
-
88
-
89
-
90
-
91
-
92
-
93
-
94
-
95
-
96
-
97
-
98
-
99
-
100
-
101
-
102
-
103
-
104
-
105
-
106
-
107
-
108
-
109
-
110
-
111
-
112
-
113
-
114
-
115
-
116
-
117
-
118
-
119
-
120
-
121
-
122
-
123
-
124
-
125
-
126
-
127
-
128
-
129
-
130
-
131
-
132
-
133
-
134
-
135
-
136
-
137
-
138
-
139
-
140
-
141
-
142
-
143
-
144
-
145
-
146
-
147
-
148
-
149
-
150
-
151
-
152
-
153
-
154
-
155
-
156
-
157
-
158
-
159
-
160
-
161
-
162
-
163
-
164
-
165
-
166
-
167
-
168
 |
 |

HEWLETT-PACKARD COMPANY AND SUBSIDIARIES
Management’s Discussion and Analysis of
Financial Condition and Results of Operations (Continued)
PC sales were the leading contributor to net revenue growth in PSG. HPS achieved net revenue growth
across all businesses in fiscal 2005 due in large part to the impact of acquisitions (benefiting primarily
technology services) and favorable currency impacts. Additionally, managed services net revenue
increased due to both new contract signings and additional contract revenue from the installed base. In
fiscal 2005, ESS net revenue growth was the result primarily of continued strong sales of industry
standard servers, particularly our ProLiant server line, due to volume increases and higher ASPs
resulting from improved option attach rates. IPG net revenue growth in fiscal 2005 was the result of
increased unit growth of printer supplies, particularly LaserJet toner, as a result of the increasing
demand for color-related products. The demand for color-related products also added to the revenue
growth in commercial hardware. Both Software and HPFS contributed to HP net revenue growth for
fiscal 2005 as growing acceptance of our OpenView product offerings contributed to Software revenue
growth while higher used equipment sales and a higher mix of operating leases benefited HPFS.
Stock-Based Compensation Expense
Effective November 1, 2005, we adopted the fair value recognition provisions of SFAS 123R using
the modified prospective transition method and therefore have not restated results for prior periods.
Our results of operations in fiscal 2006 were impacted by the recognition of non-cash expense related
to the fair value of our share-based payment awards. In fiscal 2006, we recorded $536 million in pre-tax
stock-based compensation expense based on SFAS 123R, of which $144 million was included in cost of
sales, $70 million was included in research and development expense and $322 million was included in
sales, general and administrative expense. Total stock-based compensation expense for SFAS 123R, net
of taxes, in fiscal 2006 was $376 million. In addition, we recognized an adjustment of $14 million to
reduce non-cash stock-based compensation expense which was included as part of our restructuring
expenses. The stock-based compensation expense related to HP-granted employee stock options and
the employee stock purchase plan is recorded at the corporate level and therefore does not have an
impact on segment results. See Note 2 to the Consolidated Financial Statements in Item 8, which is
incorporated herein by reference.
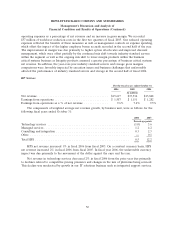
Gross Margin
The weighted average components of the change in gross margin were as follows for the following
fiscal years ended October 31:
2006 2005
Percentage points
Enterprise Storage and Servers ......................................... 0.4 0.1
HP Services ....................................................... 0.2 (0.5)
Imaging and Printing Group ........................................... 0.2 (0.8)
Software ......................................................... 0.2 0.1
Personal Systems Group .............................................. 0.1 0.5
HP Financial Services ................................................ (0.1) 0.1
Corporate Investments/Other .......................................... (0.1) —
Total HP ......................................................... 0.9 (0.5)
44