HP 2006 Annual Report Download - page 78
Download and view the complete annual report
Please find page 78 of the 2006 HP annual report below. You can navigate through the pages in the report by either clicking on the pages listed below, or by using the keyword search tool below to find specific information within the annual report.-
 1
1 -
2
-
3
-
4
-
5
-
6
-
7
-
8
-
9
-
10
-
11
-
12
-
13
-
14
-
15
-
16
-
17
-
18
-
19
-
20
-
21
-
22
-
23
-
24
-
25
-
26
-
27
-
28
-
29
-
30
-
31
-
32
-
33
-
34
-
35
-
36
-
37
-
38
-
39
-
40
-
41
-
42
-
43
-
44
-
45
-
46
-
47
-
48
-
49
-
50
-
51
-
52
-
53
-
54
-
55
-
56
-
57
-
58
-
59
-
60
-
61
-
62
-
63
-
64
-
65
-
66
-
67
-
 68
68 -
 69
69 -
 70
70 -
 71
71 -
 72
72 -
 73
73 -
 74
74 -
 75
75 -
 76
76 -
 77
77 -
 78
78 -
 79
79 -
 80
80 -
 81
81 -
 82
82 -
 83
83 -
 84
84 -
 85
85 -
 86
86 -
 87
87 -
 88
88 -
89
-
90
-
91
-
92
-
93
-
94
-
95
-
96
-
97
-
98
-
99
-
100
-
101
-
102
-
103
-
104
-
105
-
106
-
107
-
108
-
109
-
110
-
111
-
112
-
113
-
114
-
115
-
116
-
117
-
118
-
119
-
120
-
121
-
122
-
123
-
124
-
125
-
126
-
127
-
128
-
129
-
130
-
131
-
132
-
133
-
134
-
135
-
136
-
137
-
138
-
139
-
140
-
141
-
142
-
143
-
144
-
145
-
146
-
147
-
148
-
149
-
150
-
151
-
152
-
153
-
154
-
155
-
156
-
157
-
158
-
159
-
160
-
161
-
162
-
163
-
164
-
165
-
166
-
167
-
168
 |
 |

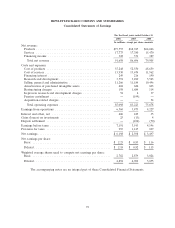
HEWLETT-PACKARD COMPANY AND SUBSIDIARIES
Consolidated Statements of Earnings
For the fiscal years ended October 31
2006 2005 2004
In millions, except per share amounts
Net revenue:
Products ........................................... $73,557 $68,945 $64,046
Services ........................................... 17,773 17,380 15,470
Financing income .................................... 328 371 389
Total net revenue ................................... 91,658 86,696 79,905
Costs and expenses:
Cost of products ..................................... 55,248 52,550 48,659
Cost of services ...................................... 13,930 13,674 11,962
Financing interest .................................... 249 216 190
Research and development .............................. 3,591 3,490 3,563
Selling, general and administrative ........................ 11,266 11,184 10,496
Amortization of purchased intangible assets ................. 604 622 603
Restructuring charges ................................. 158 1,684 114
In-process research and development charges ................ 52 2 37
Pension curtailment ................................... — (199) —
Acquisition-related charges .............................. — — 54
Total operating expenses .............................. 85,098 83,223 75,678
Earnings from operations ................................ 6,560 3,473 4,227
Interest and other, net .................................. 606 189 35
Gains (losses) on investments ............................. 25 (13) 4
Dispute settlement ..................................... — (106) (70)
Earnings before taxes ................................... 7,191 3,543 4,196
Provision for taxes ..................................... 993 1,145 699
Net earnings .......................................... $ 6,198 $ 2,398 $ 3,497
Net earnings per share:
Basic ............................................. $ 2.23 $ 0.83 $ 1.16
Diluted ............................................ $ 2.18 $ 0.82 $ 1.15
Weighted average shares used to compute net earnings per share:
Basic ............................................. 2,782 2,879 3,024
Diluted ............................................ 2,852 2,909 3,055
The accompanying notes are an integral part of these Consolidated Financial Statements.
74