HP 2006 Annual Report Download - page 54
Download and view the complete annual report
Please find page 54 of the 2006 HP annual report below. You can navigate through the pages in the report by either clicking on the pages listed below, or by using the keyword search tool below to find specific information within the annual report.-
 1
1 -
2
-
3
-
4
-
5
-
6
-
7
-
8
-
9
-
10
-
11
-
12
-
13
-
14
-
15
-
16
-
17
-
18
-
19
-
20
-
21
-
22
-
23
-
24
-
25
-
26
-
27
-
28
-
29
-
30
-
31
-
32
-
33
-
34
-
35
-
36
-
37
-
38
-
39
-
40
-
41
-
42
-
43
-
 44
44 -
 45
45 -
 46
46 -
 47
47 -
 48
48 -
 49
49 -
 50
50 -
 51
51 -
 52
52 -
 53
53 -
 54
54 -
 55
55 -
 56
56 -
 57
57 -
 58
58 -
 59
59 -
 60
60 -
 61
61 -
 62
62 -
 63
63 -
 64
64 -
65
-
66
-
67
-
68
-
69
-
70
-
71
-
72
-
73
-
74
-
75
-
76
-
77
-
78
-
79
-
80
-
81
-
82
-
83
-
84
-
85
-
86
-
87
-
88
-
89
-
90
-
91
-
92
-
93
-
94
-
95
-
96
-
97
-
98
-
99
-
100
-
101
-
102
-
103
-
104
-
105
-
106
-
107
-
108
-
109
-
110
-
111
-
112
-
113
-
114
-
115
-
116
-
117
-
118
-
119
-
120
-
121
-
122
-
123
-
124
-
125
-
126
-
127
-
128
-
129
-
130
-
131
-
132
-
133
-
134
-
135
-
136
-
137
-
138
-
139
-
140
-
141
-
142
-
143
-
144
-
145
-
146
-
147
-
148
-
149
-
150
-
151
-
152
-
153
-
154
-
155
-
156
-
157
-
158
-
159
-
160
-
161
-
162
-
163
-
164
-
165
-
166
-
167
-
168
 |
 |

HEWLETT-PACKARD COMPANY AND SUBSIDIARIES
Management’s Discussion and Analysis of
Financial Condition and Results of Operations (Continued)
Segment Information
A description of the products and services, as well as financial data, for each segment can be
found in Note 18 to the Consolidated Financial Statements in Item 8, which is incorporated herein by
reference. We have restated segment financial data for the fiscal years ended October 31, 2005 and
2004 to reflect changes in HP’s organizational structure that occurred at the beginning of the first
quarter of fiscal 2006. We describe these changes more fully in Note 18 to the Consolidated Financial
Statements in Item 8. We have presented the business segments in this Form 10-K based on our
management organizational structure as of October 31, 2006 and the distinct nature of various
businesses. Future changes to this organizational structure may result in changes to the reportable
segments disclosed. The discussions below include the results of each of our segments.
Technology Solutions Group
ESS, HPS and Software are structured beneath a broader Technology Solutions Group (‘‘TSG’’).
We describe the results of the business segments of TSG in more detail below.
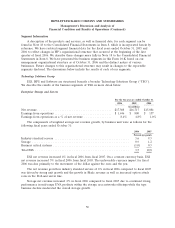
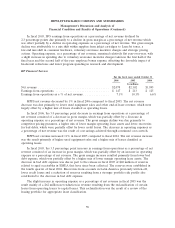
Enterprise Storage and Servers
For the fiscal years ended October 31
2006 2005 2004
In millions
Net revenue ........................................... $17,308 $16,717 $15,084
Earnings from operations ................................. $ 1,446 $ 800 $ 157
Earnings from operations as a % of net revenue ................ 8.4% 4.8% 1.0%
The components of weighted average net revenue growth, by business unit were as follows for the
following fiscal years ended October 31:
2006 2005
Percentage points
Industry standard servers ........................................... 3.6 9.3
Storage ........................................................ 0.9 1.2
Business critical systems ............................................ (1.0) 0.3
Total ESS ...................................................... 3.5 10.8
ESS net revenue increased 4% in fiscal 2006 from fiscal 2005. On a constant currency basis, ESS
net revenue increased 5% in fiscal 2006 from fiscal 2005. The unfavorable currency impact for fiscal
2006 was due primarily to the movement of the dollar against the euro and the yen.
The net revenue growth in industry standard servers of 6% in fiscal 2006 compared to fiscal 2005
was driven by strong unit growth and the growth in Blade revenue as well as increased option attach
rates in the ProLiant server line.
Storage net revenue increased 4% in fiscal 2006 compared to fiscal 2005 due to continued strong
performance in mid-range EVA products within the storage area networks offerings while the tape
business decline moderated the overall storage growth.
50