Frontier Communications 2011 Annual Report Download - page 95
Download and view the complete annual report
Please find page 95 of the 2011 Frontier Communications annual report below. You can navigate through the pages in the report by either clicking on the pages listed below, or by using the keyword search tool below to find specific information within the annual report.-
 1
1 -
2
-
3
-
4
-
5
-
6
-
7
-
8
-
9
-
10
-
11
-
12
-
13
-
14
-
15
-
16
-
17
-
18
-
19
-
20
-
21
-
22
-
23
-
24
-
25
-
26
-
27
-
28
-
29
-
30
-
31
-
32
-
33
-
34
-
35
-
36
-
37
-
38
-
39
-
40
-
41
-
42
-
43
-
44
-
45
-
46
-
47
-
48
-
49
-
50
-
51
-
52
-
53
-
54
-
55
-
56
-
57
-
58
-
59
-
60
-
61
-
62
-
63
-
64
-
65
-
66
-
67
-
68
-
69
-
70
-
71
-
72
-
73
-
74
-
75
-
76
-
77
-
78
-
79
-
80
-
81
-
82
-
83
-
84
-
 85
85 -
 86
86 -
 87
87 -
 88
88 -
 89
89 -
 90
90 -
 91
91 -
 92
92 -
 93
93 -
 94
94 -
 95
95 -
 96
96 -
 97
97 -
 98
98 -
 99
99 -
 100
100 -
 101
101 -
 102
102 -
 103
103 -
 104
104 -
 105
105
 |
 |

FRONTIER COMMUNICATIONS CORPORATION AND SUBSIDIARIES
Notes to Consolidated Financial Statements
F-32
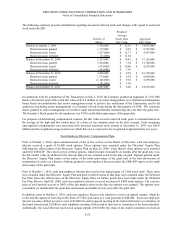
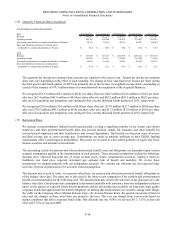
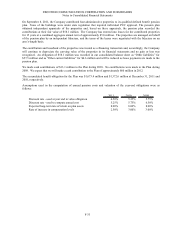
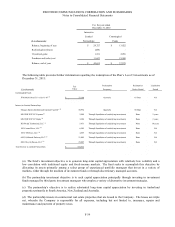
In connection with the completion of the Transaction on July 1, 2010, certain employees were transferred from various
Verizon pension plans into 12 pension plans that were then merged with the Frontier Communications Pension Plan
(the Plan) effective August 31, 2010. Assets of $438.8 million were transferred into the Plan during the second half of
2010 and assets of $106.9 million (including $18.9 million in earnings on the assets) were transferred into the Plan in
August 2011. The Plan has a receivable of $51.6 million as of December 31, 2011, that will be settled by the transfer
of assets in 2012.
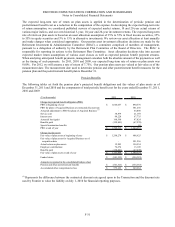
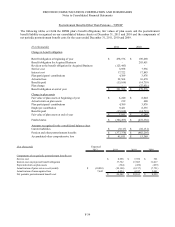
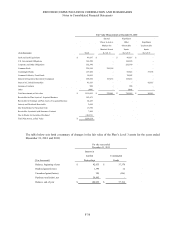
Expected
($ in thousands) 2012 2011 2010 2009
Components of total periodic benefit cost
Service cost 38,879$ 21,169$ 6,098$
Interest cost on projected benefit obligation 84,228 67,735 52,127
Expected return on plan assets (100,558) (69,831) (44,712)
Amortization of prior service cost/(credit) (199)$ (199) (199) (255)
Amortization of unrecognized loss 31,147 15,364 27,393 27,144
Net periodic benefit cost 37,714 46,267 40,402
Special termination charge - 69 1,567
Total periodic benefit cost 37,714$ 46,336$ 41,969$
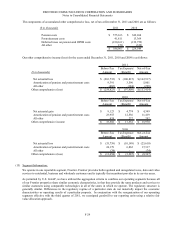
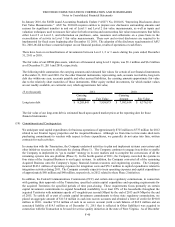
We capitalized $10.2 million, $8.3 million and $7.5 million of pension and OPEB expense into the cost of our capital
expenditures during the years ended December 31, 2011, 2010 and 2009, respectively, as the costs relate to our
engineering and plant construction activities.
Based on current assumptions and plan asset values, we estimate that our 2012 pension and other postretirement benefit
expenses will be approximately $75 million to $85 million before amounts capitalized into the cost of capital
expenditures.
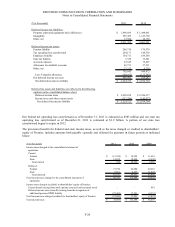
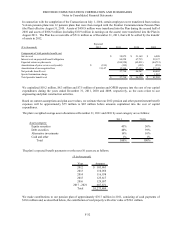
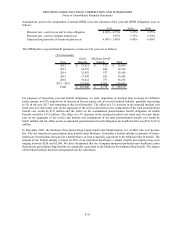
The plan’s weighted average asset allocations at December 31, 2011 and 2010 by asset category are as follows:
2011 2010
Asset category:
Equity securities 45% 50%
Debt securities 40% 39%
Alternative investments 14% 10%
Cash and other 1% 1%
Total 100% 100%
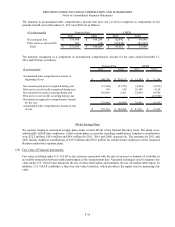
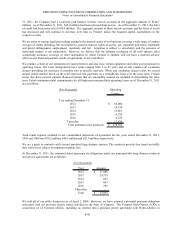
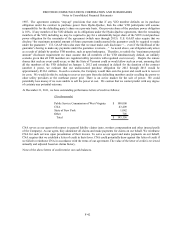
The plan’s expected benefit payments over the next 10 years are as follows:
($ in thousands)
Year Amount
2012 103,863$
2013 110,058
2014 116,938
2015 125,617
2016 129,057
2017 - 2021 687,871
Total 1,273,404$
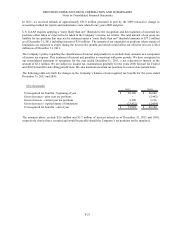
We made contributions to our pension plan of approximately $76.7 million in 2011, consisting of cash payments of
$18.6 million and, as described below, the contribution of real property with a fair value of $58.1 million.