Frontier Communications 2011 Annual Report Download - page 91
Download and view the complete annual report
Please find page 91 of the 2011 Frontier Communications annual report below. You can navigate through the pages in the report by either clicking on the pages listed below, or by using the keyword search tool below to find specific information within the annual report.-
 1
1 -
2
-
3
-
4
-
5
-
6
-
7
-
8
-
9
-
10
-
11
-
12
-
13
-
14
-
15
-
16
-
17
-
18
-
19
-
20
-
21
-
22
-
23
-
24
-
25
-
26
-
27
-
28
-
29
-
30
-
31
-
32
-
33
-
34
-
35
-
36
-
37
-
38
-
39
-
40
-
41
-
42
-
43
-
44
-
45
-
46
-
47
-
48
-
49
-
50
-
51
-
52
-
53
-
54
-
55
-
56
-
57
-
58
-
59
-
60
-
61
-
62
-
63
-
64
-
65
-
66
-
67
-
68
-
69
-
70
-
71
-
72
-
73
-
74
-
75
-
76
-
77
-
78
-
79
-
80
-
 81
81 -
 82
82 -
 83
83 -
 84
84 -
 85
85 -
 86
86 -
 87
87 -
 88
88 -
 89
89 -
 90
90 -
 91
91 -
 92
92 -
 93
93 -
 94
94 -
 95
95 -
 96
96 -
 97
97 -
 98
98 -
 99
99 -
 100
100 -
 101
101 -
102
-
103
-
104
-
105
 |
 |

FRONTIER COMMUNICATIONS CORPORATION AND SUBSIDIARIES
Notes to Consolidated Financial Statements
F-28
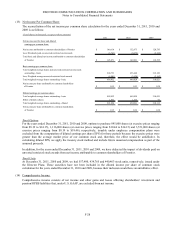
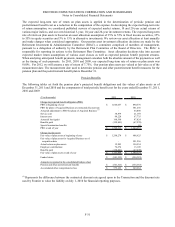
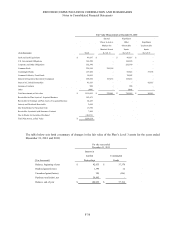
(13) Net Income Per Common Share:
The reconciliation of the net income per common share calculation for the years ended December 31, 2011, 2010 and
2009 is as follows:
($ and shares in thousands, except per-share amounts)
2011 2010 2009
Net income used for basic and diluted
earnings per common share:
Net income attributable to common shareholders of Frontier 149,614$ 152,673$ 120,783$
Less: Dividends paid on unvested restricted stock awards (3,743) (3,072) (2,248)
Total basic and diluted net income attributable to common shareholders
of Frontier 145,871$ 149,601$ 118,535$
Basic earnings per common share:
Total weighted-average shares and unvested restricted stock awards
outstanding - basic 994,753 653,248 312,183
Less: Weighted-average unvested restricted stock awards (4,901) (3,420) (2,162)
Total weighted-average shares outstanding - basic 989,852 649,828 310,021
Net income per share attributable to common shareholders
of Frontier 0.15$ 0.23$ 0.38$
Diluted earnings per common share:
Total weighted-average shares outstanding - basic 989,852 649,828 310,021
Effect of dilutive shares 1,972 1,163 92
Total weighted-average shares outstanding - diluted 991,824 650,991 310,113
Net income per share attributable to common shareholders
of Frontier 0.15$ 0.23$ 0.38$
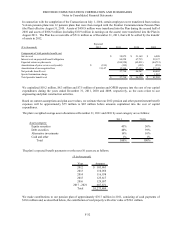
Stock Options
For the years ended December 31, 2011, 2010 and 2009, options to purchase 895,000 shares (at exercise prices ranging
from $8.19 to $14.15), 1,116,000 shares (at exercise prices ranging from $10.44 to $14.15) and 3,551,000 shares (at
exercise prices ranging from $8.19 to $18.46), respectively, issuable under employee compensation plans were
excluded from the computation of diluted earnings per share (EPS) for those periods because the exercise prices were
greater than the average market price of our common stock and, therefore, the effect would be antidilutive. In
calculating diluted EPS, we apply the treasury stock method and include future unearned compensation as part of the
assumed proceeds.
In addition, for the years ended December 31, 2011, 2010 and 2009, we have deducted the impact of dividends paid on
unvested restricted stock awards from net income attributable to common shareholders of Frontier.
Stock Units
At December 31, 2011, 2010 and 2009, we had 557,480, 434,765 and 440,463 stock units, respectively, issued under
the Director Plans. These securities have not been included in the diluted income per share of common stock
calculation for the years ended December 31, 2010 and 2009, because their inclusion would have an antidilutive effect.
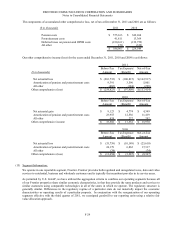
(14) Comprehensive Income:
Comprehensive income consists of net income and other gains and losses affecting shareholders’ investment and
pension/OPEB liabilities that, under U.S. GAAP, are excluded from net income.