Frontier Communications 2011 Annual Report Download - page 47
Download and view the complete annual report
Please find page 47 of the 2011 Frontier Communications annual report below. You can navigate through the pages in the report by either clicking on the pages listed below, or by using the keyword search tool below to find specific information within the annual report.-
 1
1 -
2
-
3
-
4
-
5
-
6
-
7
-
8
-
9
-
10
-
11
-
12
-
13
-
14
-
15
-
16
-
17
-
18
-
19
-
20
-
21
-
22
-
23
-
24
-
25
-
26
-
27
-
28
-
29
-
30
-
31
-
32
-
33
-
34
-
35
-
36
-
 37
37 -
 38
38 -
 39
39 -
 40
40 -
 41
41 -
 42
42 -
 43
43 -
 44
44 -
 45
45 -
 46
46 -
 47
47 -
 48
48 -
 49
49 -
 50
50 -
 51
51 -
 52
52 -
 53
53 -
 54
54 -
 55
55 -
 56
56 -
 57
57 -
58
-
59
-
60
-
61
-
62
-
63
-
64
-
65
-
66
-
67
-
68
-
69
-
70
-
71
-
72
-
73
-
74
-
75
-
76
-
77
-
78
-
79
-
80
-
81
-
82
-
83
-
84
-
85
-
86
-
87
-
88
-
89
-
90
-
91
-
92
-
93
-
94
-
95
-
96
-
97
-
98
-
99
-
100
-
101
-
102
-
103
-
104
-
105
 |
 |

FRONTIER COMMUNICATIONS CORPORATION AND SUBSIDIARIES
44
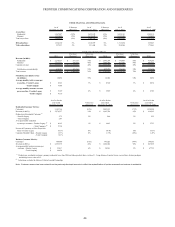
As of % Increase As of % Increase As of As of
December 31, 2011 (Decrease) December 31, 2010 (Decrease) July 1, 2010 December 31, 2009
Access lines:
Residential 3,267,487 (10%) 3,635,670 (6%) 3,855,141 1,349,510
Business 1,999,429 (5%) 2,110,048 (2%) 2,154,109 768,002
Total access lines 5,266,916 (8%) 5,745,718 (4%) 6,009,250 2,117,512
HSI subscribers 1,764,160 3% 1,718,959 0% 1,715,454 635,947
Video subscribers 557,527 5% 531,446 5% 504,544 172,961
$ Increase % Increase $ Increase % Increase
2011 (Decrease) (Decrease) 2010 (Decrease) (Decrease) 2009
Revenue (in 000's):
Residential 2,270,527$ 577,173$ 34% 1,693,354$ 779,059$ 85% 914,295$
Business 2,353,375 746,829 46% 1,606,546 762,581 90% 843,965
Customer revenue 4,623,902$ 1,324,002$ 40% 3,299,900$ 1,541,640$ 88% 1,758,260$
Switched access and subsidy 619,141 121,366 24% 497,775 138,141 38% 359,634
Total revenue 5,243,043$ 1,445,368$ 38% 3,797,675$ 1,679,781$ 79% 2,117,894$
Switched access minutes of use
(in millions) 18,894 30% 14,542 64% 8,854
Average monthly total revenue per
access line - Frontier Legacy 85.43$ 3% 83.20$ 3% 80.74$
- Total Company 79.48$
Average monthly customer revenue
per access line - Frontier Legacy 72.49$ 4% 69.89$ 4% 67.03$
- Total Company 70.10$
As of or for the As of or for the As of or for the
year ended % Increase year ended % Increase year ended
December 31, 2011 (Decrease) December 31, 2010 (Decrease) December 31, 2009
Residential Customer Metrics:
Customers 3,103,766 (10%) 3,445,193 175% 1,254,508
Revenue (in 000's) 2,270,527$ 34% 1,693,354$ 85% 914,295$
Products per Residential Customer
(1)
- Frontier Legacy 2.72 5% 2.60 3% 2.52
- Total Company 2.47
Average monthly residential
revenue per customer - Frontier Legacy
(2)
60.65$ 1% 60.03$ 5% 57.33$
- Total Company
(2)
57.34$
Percent of Customers on Price Protection
Plans - Frontier Legacy 63.1% 8% 58.4% 10% 53.3%
Customer Monthly Churn - Frontier Legacy 1.33% 0% 1.33% (10%) 1.47%
- Total Company 1.61%
Business Customer Metrics:
Customers 309,900 (10%) 343,823 144% 140,763
Revenue (in 000's) 2,353,375$ 46% 1,606,546$ 90% 843,965$
Average monthly business revenue per
customer - Frontier Legacy 530.17$ 6% 502.41$ 5% 477.52$
- Total Company 600.38$
(1)
Products per residential customer: primary residential voice line, HSI and video products have a value of 1. Long distance, Frontier Secure, second lines, feature packages
and dial-up have a value of 0.5.
(2)
Calculation excludes the Mohave Cellular Limited Partnership.
Note: Customer revenue has been revised from the previously disclosed amounts to reflect the reclassification of certain revenues from business to residential.
OTHER FINANCIAL AND OPERATING DATA
For the year ended December 31,