Frontier Communications 2011 Annual Report Download - page 52
Download and view the complete annual report
Please find page 52 of the 2011 Frontier Communications annual report below. You can navigate through the pages in the report by either clicking on the pages listed below, or by using the keyword search tool below to find specific information within the annual report.-
 1
1 -
2
-
3
-
4
-
5
-
6
-
7
-
8
-
9
-
10
-
11
-
12
-
13
-
14
-
15
-
16
-
17
-
18
-
19
-
20
-
21
-
22
-
23
-
24
-
25
-
26
-
27
-
28
-
29
-
30
-
31
-
32
-
33
-
34
-
35
-
36
-
37
-
38
-
39
-
40
-
41
-
 42
42 -
 43
43 -
 44
44 -
 45
45 -
 46
46 -
 47
47 -
 48
48 -
 49
49 -
 50
50 -
 51
51 -
 52
52 -
 53
53 -
 54
54 -
 55
55 -
 56
56 -
 57
57 -
 58
58 -
 59
59 -
 60
60 -
 61
61 -
 62
62 -
63
-
64
-
65
-
66
-
67
-
68
-
69
-
70
-
71
-
72
-
73
-
74
-
75
-
76
-
77
-
78
-
79
-
80
-
81
-
82
-
83
-
84
-
85
-
86
-
87
-
88
-
89
-
90
-
91
-
92
-
93
-
94
-
95
-
96
-
97
-
98
-
99
-
100
-
101
-
102
-
103
-
104
-
105
 |
 |

FRONTIER COMMUNICATIONS CORPORATION AND SUBSIDIARIES
49
All other operating expenses for 2010 increased $434.2 million, or 116%, to $807.4 million, as compared with 2009. All other
operating expenses for 2010 increased $459.8 million as a result of the Acquired Business. All other operating expenses for
our Frontier legacy operations decreased $25.6 million, or 7%, to $347.6 million, as compared with 2009, primarily due to
$29.2 million in corporate costs allocated to the Acquired Business, partially offset by higher USF surcharges, higher
electricity and fuel costs, and higher travel costs incurred in connection with the Acquired Business.
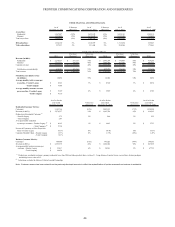
2009
($ in thousands) $ Increase % Increase $ Increase % Increase
Amount (Decrease) (Decrease) Amount (Decrease) (Decrease) Amount
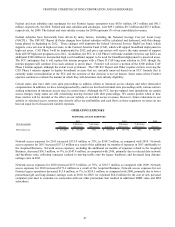
Depreciation expense 881,481$ 281,819$ 47% 599,662$ 237,434$ 66% 362,228$
Amortization expense 521,694 227,637 77% 294,057 179,894 158% 114,163
1,403,175$ 509,456$ 57% 893,719$ 417,328$ 88% 476,391$
2011 2010
DEPRECIATION AND AMORTIZATION EXPENSE
Depreciation and amortization expense for 2011 increased $509.5 million, or 57%, to $1,403.2 million, as compared to 2010.
Depreciation and amortization expense increased $510.9 million as a result of the additional six months of expenses in 2011
attributable to the Acquired Business. Depreciation expense, excluding the additional six months of expense related to the
Acquired Business, increased $8.6 million, or 1%, to $608.2 million, as compared with 2010, primarily due to changes in the
remaining useful lives of certain assets. We annually commission an independent study to update the estimated remaining
useful lives of our plant assets. The latest study was completed in the fourth quarter of 2011 and after review and analysis of
the results, we adopted new lives for certain plant assets as of October 1, 2011. Our “composite depreciation rate” for plant
assets was 6.4% as a result of the study. We anticipate depreciation expense of approximately $815 million to $835 million
for 2012. Amortization expense, excluding the additional six months of expense related to the Acquired Business, decreased
$10.0 million, or 3%, to $284.1 million, as compared with 2010. Amortization expense for 2011 and 2010 included $465.4
million and $237.8 million, respectively, for intangible assets (primarily customer base) that were acquired in the Transaction
based on an estimated fair value of $2.5 billion and an estimated useful life of nine years for the residential customer list and
12 years for the business customer list, amortized on an accelerated method. We anticipate amortization expense of
approximately $420 million for 2012.
Depreciation and amortization expense for 2010 increased $417.3 million, or 88%, to $893.7 million, as compared with 2009.
Depreciation and amortization expense for 2010 increased $494.8 million as a result of the Acquired Business. Depreciation
and amortization expense for our Frontier legacy operations decreased $77.5 million, or 16%, to $398.9 million, as compared
with 2009, primarily due to reduced amortization expense, as discussed below, and a declining net asset base, partially offset
by changes in the remaining useful lives of certain assets.
We revised our useful lives for Frontier legacy plant assets based on a study effective October 1, 2010 and the plant assets of
the Acquired Business based on the study effective July 1, 2010. Our “composite depreciation rate” for plant assets was 7.6%
as a result of the study.
Amortization expense for 2009 is comprised of $57.9 million for amortization associated with certain Frontier legacy
properties, which were fully amortized in June 2009, and $56.3 million for intangible assets (customer base and trade name)
that were acquired in the acquisitions of Commonwealth Telephone Enterprises, Inc., Global Valley Networks, Inc. and GVN
Services.
2009
($ in thousands) $ Increase % Increase $ Increase % Increase
Amount (Decrease) (Decrease) Amount (Decrease) (Decrease) Amount
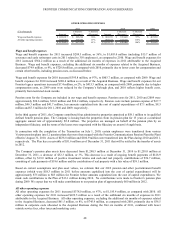
Acquisition and
integration costs 143,146$ 6,004$ 4% 137,142$ 108,808$ 384% 28,334$
ACQUISITION AND INTEGRATION COSTS
2011 2010
Acquisition and integration costs include expenses incurred to close the Transaction (legal, financial advisory, accounting,
regulatory and other related costs) and integrate the network and information technology platforms by closing (Phase 1). In