Frontier Communications 2011 Annual Report Download - page 53
Download and view the complete annual report
Please find page 53 of the 2011 Frontier Communications annual report below. You can navigate through the pages in the report by either clicking on the pages listed below, or by using the keyword search tool below to find specific information within the annual report.-
 1
1 -
2
-
3
-
4
-
5
-
6
-
7
-
8
-
9
-
10
-
11
-
12
-
13
-
14
-
15
-
16
-
17
-
18
-
19
-
20
-
21
-
22
-
23
-
24
-
25
-
26
-
27
-
28
-
29
-
30
-
31
-
32
-
33
-
34
-
35
-
36
-
37
-
38
-
39
-
40
-
41
-
42
-
 43
43 -
 44
44 -
 45
45 -
 46
46 -
 47
47 -
 48
48 -
 49
49 -
 50
50 -
 51
51 -
 52
52 -
 53
53 -
 54
54 -
 55
55 -
 56
56 -
 57
57 -
 58
58 -
 59
59 -
 60
60 -
 61
61 -
 62
62 -
 63
63 -
64
-
65
-
66
-
67
-
68
-
69
-
70
-
71
-
72
-
73
-
74
-
75
-
76
-
77
-
78
-
79
-
80
-
81
-
82
-
83
-
84
-
85
-
86
-
87
-
88
-
89
-
90
-
91
-
92
-
93
-
94
-
95
-
96
-
97
-
98
-
99
-
100
-
101
-
102
-
103
-
104
-
105
 |
 |

FRONTIER COMMUNICATIONS CORPORATION AND SUBSIDIARIES
50
2011, the Company continued to implement its “go to market” final strategy in its new markets, to complete the conversions
of all the remaining systems into one platform and to achieve its cost synergies (Phase 2). During the fourth quarter of 2011,
the Company converted all systems in four states of the Acquired Business to our legacy systems.
In addition, the Company converted all of the nine remaining states of the Acquired Business onto the Company’s legacy
financial, human resources and engineering systems. The Company incurred $143.1 million and $137.1 million of operating
expenses and $76.5 million and $97.0 million in capital expenditures related to acquisition and integration activities during
2011 and 2010, respectively. The Company currently expects to incur operating expenses and capital expenditures related to
completing its Phase 2 initiatives of approximately $80 million and $40 million, respectively, in 2012.
2009
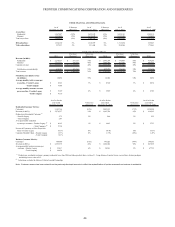
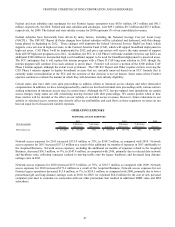
($ in thousands) $ Increase % Increase $ Increase % Increase
Amount (Decrease) (Decrease) Amount (Decrease) (Decrease) Amount
Investment income
2,391$ (4,457)$ (65%) 6,848$ 563$ 9% 6,285$
Other income (loss), net 9,135$ (4,555)$ (33%) 13,690$ 54,817$ 133% (41,127)$
Interest expense 665,196$ 143,376$ 27% 521,820$ 143,606$ 38% 378,214$
Income tax expense 88,343$ (26,656)$ (23%) 114,999$ 45,071$ 64% 69,928$
INVESTMENT INCOME/OTHER INCOME (LOSS), NET / INTEREST EXPENSE /
2011 2010
INCOME TAX EXPENSE
Investment Income
Investment income for 2011 decreased $4.5 million to $2.4 million, as compared with 2010, primarily due to a decrease of
$1.3 million in equity earnings, a decrease in investment gains of $1.9 million in 2011, and a $1.3 million decrease in income
from short-term investments of cash (including restricted cash).
Investment income for 2010 improved $0.6 million to $6.8 million, as compared with 2009, primarily due to a $3.0 million
gain associated with cash received during 2010 on a previously written-off investment, partially offset by a decrease of $1.8
million in income from short-term investments of cash and cash equivalents, due to lower short-term investment rates, and a
decrease of $0.6 million in equity earnings.
Our average cash balances were $275.0 million, $304.7 million and $318.0 million for 2011, 2010 and 2009, respectively.
Our average restricted cash balance was $170.5 million for 2011.
Other Income (Loss), net
Other income, net for 2011 decreased $4.6 million to $9.1 million, as compared with 2010, primarily due to a gain of $4.5
million on a split-dollar life insurance policy settlement recognized in the second quarter of 2010.
Other income (loss), net for 2010 improved $54.8 million to $13.7 million as compared with 2009, primarily due to the loss
on early retirement of debt of $45.9 million recognized in 2009. 2010 reflects a $4.5 million gain on a life insurance policy
settlement and an increase of $2.2 million in settlement of customer advances.
Interest Expense
Interest expense for 2011 increased $143.4 million, or 27%, to $665.2 million, as compared with 2010, primarily due to
higher average debt levels during 2011. Interest expense for 2011 included $284.4 million associated with the assumed debt
from the Transaction. Our composite average borrowing rate as of December 31, 2011 was 7.92%.
Interest expense for 2010 increased $143.6 million, or 38%, to $521.8 million, as compared with 2009, primarily due to
higher average debt levels in 2010. Interest expense for 2010 included $143.2 million associated with the assumed debt from
the Transaction. Our composite average borrowing rate as of December 31, 2010 and 2009 was 8.04% and 7.85%,
respectively.
Our average debt outstanding was $8,299.8 million, $6,950.9 million and $4,867.2 million for 2011, 2010 and 2009,
respectively. Our debt levels have risen primarily due to the $3.5 billion of debt that was assumed by Frontier upon
consummation of the Transaction.