Frontier Communications 2011 Annual Report Download - page 42
Download and view the complete annual report
Please find page 42 of the 2011 Frontier Communications annual report below. You can navigate through the pages in the report by either clicking on the pages listed below, or by using the keyword search tool below to find specific information within the annual report.-
 1
1 -
2
-
3
-
4
-
5
-
6
-
7
-
8
-
9
-
10
-
11
-
12
-
13
-
14
-
15
-
16
-
17
-
18
-
19
-
20
-
21
-
22
-
23
-
24
-
25
-
26
-
27
-
28
-
29
-
30
-
31
-
 32
32 -
 33
33 -
 34
34 -
 35
35 -
 36
36 -
 37
37 -
 38
38 -
 39
39 -
 40
40 -
 41
41 -
 42
42 -
 43
43 -
 44
44 -
 45
45 -
 46
46 -
 47
47 -
 48
48 -
 49
49 -
 50
50 -
 51
51 -
 52
52 -
53
-
54
-
55
-
56
-
57
-
58
-
59
-
60
-
61
-
62
-
63
-
64
-
65
-
66
-
67
-
68
-
69
-
70
-
71
-
72
-
73
-
74
-
75
-
76
-
77
-
78
-
79
-
80
-
81
-
82
-
83
-
84
-
85
-
86
-
87
-
88
-
89
-
90
-
91
-
92
-
93
-
94
-
95
-
96
-
97
-
98
-
99
-
100
-
101
-
102
-
103
-
104
-
105
 |
 |
FRONTIER COMMUNICATIONS CORPORATION AND SUBSIDIARIES
39
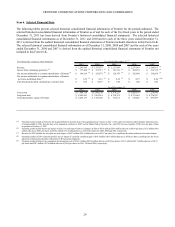
asset groups, during the three years ended December 31, 2011. The latest study was completed in the fourth quarter of 2011
and after review and analysis of the results, we adopted new estimated remaining useful lives for certain plant assets as of
October 1, 2011. Our composite depreciation rate for plant assets was 6.4% as a result of this study.
Intangible assets acquired in the Transaction were recorded at an estimated fair value of $2.5 billion with an estimated useful
life of nine years for the residential customer list, as distinguished from the 12 years used for the business customer list. For
both classes of assets, the “sum of the years digits” method is used to amortize the intangible assets, which tracks more
closely with the projected revenue stream of each asset class. Our Frontier legacy customer list intangible assets do not
distinguish between residential and business classes and the amortization period is five years on the straight-line method. We
periodically reassess the useful life of our intangible assets to determine whether any changes to those lives are required.
We anticipate depreciation expense of approximately $815 million to $835 million and amortization expense of
approximately $420 million for 2012.
Pension and Other Postretirement Benefits
Our estimates of pension expense, other postretirement benefits including retiree medical benefits and related liabilities are
“critical accounting estimates.” In connection with the completion of the Transaction on July 1, 2010, certain employees were
transferred from various Verizon pension plans into 12 pension plans that were then merged with the Frontier
Communications Pension Plan (the Plan) effective August 31, 2010. Assets of $438.8 million were transferred into the Plan
during the second half of 2010 and assets of $106.9 million were transferred into the Plan in August 2011. The Plan has a
receivable of $51.6 million as of December 31, 2011, that will be settled by the transfer of assets in early 2012. We sponsor a
noncontributory defined benefit pension plan covering a significant number of our current and former Frontier legacy
employees and other postretirement benefit plans that provide medical, dental, life insurance and other benefits for covered
retired employees and their beneficiaries and covered dependents. All of the employees who are still accruing pension
benefits are employees represented by unions. The accounting results for pension and other postretirement benefit costs and
obligations are dependent upon various actuarial assumptions applied in the determination of such amounts. These actuarial
assumptions include the following: discount rates, expected long-term rate of return on plan assets, future compensation
increases, employee turnover, healthcare cost trend rates, expected retirement age, optional form of benefit and mortality. We
review these assumptions for changes annually with our independent actuaries. We consider our discount rate and expected
long-term rate of return on plan assets to be our most critical assumptions.
The discount rate is used to value, on a present value basis, our pension and other postretirement benefit obligations (OPEB) as of
the balance sheet date. The same rate is also used in the interest cost component of the pension and postretirement benefit cost
determination for the following year. The measurement date used in the selection of our discount rate is the balance sheet date.
Our discount rate assumption is determined annually with assistance from our actuaries based on the pattern of expected future
benefit payments and the prevailing rates available on long-term, high quality corporate bonds that approximate the benefit
obligation. In making this determination we consider, among other things, the yields on the Citigroup Above-Median Pension
Curve, the Towers-Watson Index, the general movement of interest rates and the changes in those rates from one period to the
next. This rate can change from year-to-year based on market conditions that affect corporate bond yields. Our discount rate
was 4.50% for valuation of the year end pension obligations and 4.50% - 4.75% for valuations of the year end OPEB obligations
at year-end 2011, and 5.25% at year-end 2010.
The expected long-term rate of return on plan assets is applied in the determination of periodic pension and postretirement benefit
cost as a reduction in the computation of the expense. In developing the expected long-term rate of return assumption, we
considered published surveys of expected market returns, 10 and 20 year actual returns of various major indices, and our own
historical 5 year, 10 year and 20 year investment returns. The expected long-term rate of return on plan assets is based on an asset
allocation assumption of 35% to 55% in fixed income securities, 35% to 55% in equity securities and 5% to 15% in alternative
investments. We review our asset allocation at least annually and make changes when considered appropriate. Our asset return
assumption is made at the beginning of our fiscal year. In 2009, 2010 and 2011, our expected long-term rate of return on plan
assets was 8.0%. Our actual return on plan assets in 2011 was 1.9%. For 2012, we will assume a rate of return of 7.75%. Our
pension plan assets are valued at fair value as of the measurement date.
We expect that our pension and other postretirement benefit expenses for 2012 will be approximately $75 million to $85 million
before amounts capitalized into the cost of capital expenditures. In 2011, they were $58.3 million before amounts capitalized into
the cost of capital expenditures. We expect to make contributions to our pension plan of approximately $60 million in 2012. We
made contributions to our pension plan of approximately $76.7 million in 2011, consisting of cash payments of $18.6 million and