Frontier Communications 2011 Annual Report Download - page 70
Download and view the complete annual report
Please find page 70 of the 2011 Frontier Communications annual report below. You can navigate through the pages in the report by either clicking on the pages listed below, or by using the keyword search tool below to find specific information within the annual report.-
 1
1 -
2
-
3
-
4
-
5
-
6
-
7
-
8
-
9
-
10
-
11
-
12
-
13
-
14
-
15
-
16
-
17
-
18
-
19
-
20
-
21
-
22
-
23
-
24
-
25
-
26
-
27
-
28
-
29
-
30
-
31
-
32
-
33
-
34
-
35
-
36
-
37
-
38
-
39
-
40
-
41
-
42
-
43
-
44
-
45
-
46
-
47
-
48
-
49
-
50
-
51
-
52
-
53
-
54
-
55
-
56
-
57
-
58
-
59
-
 60
60 -
 61
61 -
 62
62 -
 63
63 -
 64
64 -
 65
65 -
 66
66 -
 67
67 -
 68
68 -
 69
69 -
 70
70 -
 71
71 -
 72
72 -
 73
73 -
 74
74 -
 75
75 -
 76
76 -
 77
77 -
 78
78 -
 79
79 -
 80
80 -
81
-
82
-
83
-
84
-
85
-
86
-
87
-
88
-
89
-
90
-
91
-
92
-
93
-
94
-
95
-
96
-
97
-
98
-
99
-
100
-
101
-
102
-
103
-
104
-
105
 |
 |

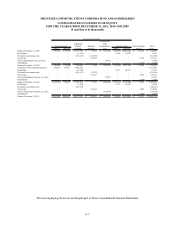
F-7
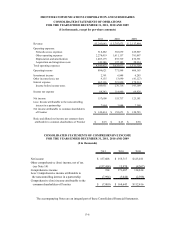
FRONTIER COMMUNICATIONS CORPORATION AND SUBSIDIARIES
CONSOLIDATED STATEMENTS OF EQUITY
FOR THE YEARS ENDED DECEMBER 31, 2011, 2010 AND 2009
($ and shares in thousands)
Accumulated
Additional Other
Paid-In Retained Comprehensive Noncontrolling Total
Shares Amount Capital Earnings Loss Shares Amount Interest Equity
Balance December 31, 2008 349,456 87,364$ 1,117,936$ 38,163$ (237,152)$ (38,142) (487,266)$ 10,561$ 529,606$
Stock plans - - (5,359) - - 1,014 13,875 - 8,516
Dividends on common stock - - (156,176) (156,190) - - - - (312,366)
Net income - - - 120,783 - - - 2,398 123,181
Other comprehensive loss, net of tax - - - - (8,367) - - - (8,367)
Distributions - - - - - - - (1,500) (1,500)
Balance December 31, 2009 349,456 87,364 956,401 2,756 (245,519) (37,128) (473,391) 11,459 339,070
Acquisition of the Acquired Business 678,530 169,633 5,048,266 - - - - - 5,217,899
Stock plans - - (28,129) - - 2,997 40,105 - 11,976
Dividends on common stock - - (451,067) (78,322) - - - - (529,389)
Net income - - - 152,673 - - - 3,044 155,717
Other comprehensive income, net of tax - - - - 15,970 - - - 15,970
Distributions - - - - - - - (1,500) (1,500)
Balance December 31, 2010 1,027,986 256,997 5,525,471 77,107 (229,549) (34,131) (433,286) 13,003 5,209,743
Stock plans - - (5,701) - - 1,273 18,285 - 12,584
Dividends on common stock - - (746,387) - - - - - (746,387)
Net income - - - 149,614 - - - 7,994 157,608
Other comprehensive income, net of tax - - - - (157,414) - - - (157,414)
Distributions - - - - - - - (7,000) (7,000)
Balance December 31, 2011 1,027,986 256,997$ 4,773,383$ 226,721$ (386,963)$ (32,858) (415,001)$ 13,997$ 4,469,134$
Common Stock Treasury Stock
Frontier Shareholders
The accompanying Notes are an integral part of these Consolidated Financial Statements.