Frontier Communications 2011 Annual Report Download - page 71
Download and view the complete annual report
Please find page 71 of the 2011 Frontier Communications annual report below. You can navigate through the pages in the report by either clicking on the pages listed below, or by using the keyword search tool below to find specific information within the annual report.-
 1
1 -
2
-
3
-
4
-
5
-
6
-
7
-
8
-
9
-
10
-
11
-
12
-
13
-
14
-
15
-
16
-
17
-
18
-
19
-
20
-
21
-
22
-
23
-
24
-
25
-
26
-
27
-
28
-
29
-
30
-
31
-
32
-
33
-
34
-
35
-
36
-
37
-
38
-
39
-
40
-
41
-
42
-
43
-
44
-
45
-
46
-
47
-
48
-
49
-
50
-
51
-
52
-
53
-
54
-
55
-
56
-
57
-
58
-
59
-
60
-
 61
61 -
 62
62 -
 63
63 -
 64
64 -
 65
65 -
 66
66 -
 67
67 -
 68
68 -
 69
69 -
 70
70 -
 71
71 -
 72
72 -
 73
73 -
 74
74 -
 75
75 -
 76
76 -
 77
77 -
 78
78 -
 79
79 -
 80
80 -
 81
81 -
82
-
83
-
84
-
85
-
86
-
87
-
88
-
89
-
90
-
91
-
92
-
93
-
94
-
95
-
96
-
97
-
98
-
99
-
100
-
101
-
102
-
103
-
104
-
105
 |
 |

F-8
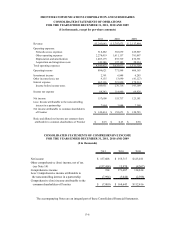
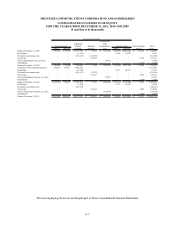
FRONTIER COMMUNICATIONS CORPORATION AND SUBSIDIARIES
CONSOLIDATED STATEMENTS OF CASH FLOWS
FOR THE YEARS ENDED DECEMBER 31, 2011, 2010 AND 2009
($ in thousands)
2011 2010 2009
Cash flows provided by (used in) operating activities:
Net income 157,608$ 155,717$ 123,181$
Adjustments to reconcile net income to net cash provided by
operating activities:
Depreciation and amortization expense 1,403,175 893,719 476,391
Stock based compensation expense 14,209 14,473 9,368
Pension/OPEB costs 23,897 40,050 34,196
Loss on extinguishment of debt, net - - 45,939
Other non-cash adjustments (28,036) 10,072 2,080
Deferred income taxes 87,411 85,432 61,217
Change in accounts receivable (72,600) (33,146) 21,906
Change in accounts payable and other liabilities (84,689) 106,433 13,297
Change in prepaid expenses, income taxes and other current assets 71,706 (50,570) (44,855)
Net cash provided by operating activities 1,572,681 1,222,180 742,720
Cash flows provided from (used by) investing activities:
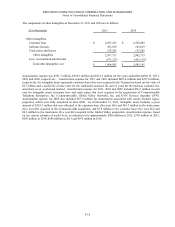
Capital expenditures - Business operations (748,361) (480,888) (230,966)
Capital expenditures - Integration activities (76,478) (96,991) (24,999)
Cash transferred from (to) escrow 43,012 (115,000) -
Cash paid for the Acquired Business (net of cash acquired) - (82,560) -
Other assets purchased and distributions received, net 19,155 1,484 673
Net cash used by investing activities (762,672) (773,955) (255,292)
Cash flows provided from (used by) financing activities:
Long-term debt borrowings 575,000 - 1,117,476
Financing costs paid (5,444) (12,868) (2,204)
Long-term debt payments (552,394) (7,236) (1,027,408)
Premium paid to retire debt - - (66,868)
Issuance of common stock - - 751
Dividends paid (746,387) (529,389) (312,366)
Repayment of customer advances for construction,
distributions to noncontrolling interests and other (5,953) (6,162) (1,743)
Net cash used by financing activities (735,178) (555,655) (292,362)
Increase (decrease) in cash and cash equivalents 74,831 (107,430) 195,066
Cash and cash equivalents at January 1, 251,263 358,693 163,627
Cash and cash equivalents at December 31, 326,094$ 251,263$ 358,693$
Supplemental cash flow information:
Cash paid during the period for:
Interest 653,500$ 511,354$ 364,167$
Income taxes (refunds) (33,072)$ 19,885$ 59,735$
Non-cash investing and financing activities:
Financing obligation for contribution of real property to
pension plan 58,100$ -$ -$
Reduction of pension obligation (58,100)$ -$ -$
Shares issued for the Acquired Business -$ 5,217,899$ -$
Assumed debt -$ 3,456,782$ -$
Other acquired liabilities -$ 987,510$ -$
Increase (decrease) in capital expenditures due to changes in accounts payable 1,338$ (43,978)$ -$
The accompanying Notes are an integral part of these Consolidated Financial Statements.