Frontier Communications 2011 Annual Report Download - page 46
Download and view the complete annual report
Please find page 46 of the 2011 Frontier Communications annual report below. You can navigate through the pages in the report by either clicking on the pages listed below, or by using the keyword search tool below to find specific information within the annual report.-
 1
1 -
2
-
3
-
4
-
5
-
6
-
7
-
8
-
9
-
10
-
11
-
12
-
13
-
14
-
15
-
16
-
17
-
18
-
19
-
20
-
21
-
22
-
23
-
24
-
25
-
26
-
27
-
28
-
29
-
30
-
31
-
32
-
33
-
34
-
35
-
 36
36 -
 37
37 -
 38
38 -
 39
39 -
 40
40 -
 41
41 -
 42
42 -
 43
43 -
 44
44 -
 45
45 -
 46
46 -
 47
47 -
 48
48 -
 49
49 -
 50
50 -
 51
51 -
 52
52 -
 53
53 -
 54
54 -
 55
55 -
 56
56 -
57
-
58
-
59
-
60
-
61
-
62
-
63
-
64
-
65
-
66
-
67
-
68
-
69
-
70
-
71
-
72
-
73
-
74
-
75
-
76
-
77
-
78
-
79
-
80
-
81
-
82
-
83
-
84
-
85
-
86
-
87
-
88
-
89
-
90
-
91
-
92
-
93
-
94
-
95
-
96
-
97
-
98
-
99
-
100
-
101
-
102
-
103
-
104
-
105
 |
 |
FRONTIER COMMUNICATIONS CORPORATION AND SUBSIDIARIES
43
During 2011, we lost approximately 11,800 FiOS data customers and added approximately 57,000 other HSI subscribers. In
connection with the Transaction, the Company agreed to focus primarily on certain capital investment commitments to
expand broadband availability and speeds. The Company plans to significantly expand broadband availability and speed over
the next several years. We expect to continue to increase HSI subscribers in 2012.
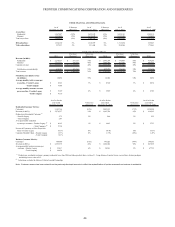
While the number of access lines is an important metric to gauge certain revenue trends, it is not necessarily the best or only
measure to evaluate our business. Management believes that customer counts and understanding different components of
revenue is most important. For this reason, presented in the table titled “Other Financial and Operating Data” below is an
analysis that presents customer counts, average monthly revenue, products per customer, percentage of customers on price
protection plans and churn. It also categorizes revenue into customer revenue (residential and business) and regulatory
revenue (switched access and subsidy revenue). Despite the 7% decline in residential customers and the 6% decline in total
access lines, customer revenue (all revenue except switched access and subsidy revenue) for our Frontier legacy operations,
declined in 2011 by only 2 percent as compared to the prior year. The decline in customers and access lines was partially
offset by increased penetration of additional products sold to both residential and business customers, which has increased our
average monthly revenue per customer. A substantial further loss of customers and access lines, combined with increased
competition and the other factors discussed herein may cause our revenue, profitability and cash flows to decrease in 2012.