Frontier Communications 2011 Annual Report Download - page 10
Download and view the complete annual report
Please find page 10 of the 2011 Frontier Communications annual report below. You can navigate through the pages in the report by either clicking on the pages listed below, or by using the keyword search tool below to find specific information within the annual report.-
 1
1 -
 2
2 -
 3
3 -
 4
4 -
 5
5 -
 6
6 -
 7
7 -
 8
8 -
 9
9 -
 10
10 -
 11
11 -
 12
12 -
 13
13 -
 14
14 -
 15
15 -
 16
16 -
 17
17 -
 18
18 -
 19
19 -
 20
20 -
 21
21 -
22
-
23
-
24
-
25
-
26
-
27
-
28
-
29
-
30
-
31
-
32
-
33
-
34
-
35
-
36
-
37
-
38
-
39
-
40
-
41
-
42
-
43
-
44
-
45
-
46
-
47
-
48
-
49
-
50
-
51
-
52
-
53
-
54
-
55
-
56
-
57
-
58
-
59
-
60
-
61
-
62
-
63
-
64
-
65
-
66
-
67
-
68
-
69
-
70
-
71
-
72
-
73
-
74
-
75
-
76
-
77
-
78
-
79
-
80
-
81
-
82
-
83
-
84
-
85
-
86
-
87
-
88
-
89
-
90
-
91
-
92
-
93
-
94
-
95
-
96
-
97
-
98
-
99
-
100
-
101
-
102
-
103
-
104
-
105
 |
 |

FRONTIER COMMUNICATIONS CORPORATION AND SUBSIDIARIES
7
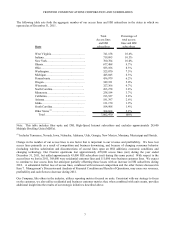
The following table sets forth the aggregate number of our access lines and HSI subscribers in the states in which we
operated as of December 31, 2011.
Total Percentage of
Access lines total access
and HSI lines and HSI
State subscribers subscribers
West Virginia……………………………… 741,158 10.6%
Indiana…………………………………….. 719,095 10.3%
New York………………………………….. 700,704 10.0%
Illinois……………………………………… 677,488 9.7%
Ohio……………………………………….. 583,106 8.3%
Washington………………………………. 525,070 7.5%
Michigan…………………………………. 445,045 6.3%
Pennsylvania…………….…..…………… 436,979 6.2%
Oregon…………………….………………. 349,331 5.0%
Wisconsin…………………..……………. 327,366 4.7%
North Carolina……………………………. 263,278 3.8%
Minnesota………………………...………. 258,184 3.7%
California……………………………..…… 193,527 2.8%
Arizona…………………………………….. 181,397 2.6%
Idaho………………………………………. 131,170 1.9%
South Carolina……………………………. 104,908 1.4%
Other States
(1)
……………...…….………. 364,664 5.2%
Total ……………………………………. 7,002,470 100%
_______________________
Note: This table includes fiber optic and DSL High-Speed Internet subscribers and excludes approximately 28,600
Multiple Dwelling Units (MDUs).
(1) Includes Tennessee, Nevada, Iowa, Nebraska, Alabama, Utah, Georgia, New Mexico, Montana, Mississippi and Florida.
Change in the number of our access lines is one factor that is important to our revenue and profitability. We have lost
access lines primarily as a result of competition and business downsizing, and because of changing consumer behavior
(including wireless substitution and disconnections of second lines upon an HSI addition), economic conditions and
changing technology. Our Frontier operations lost approximately 479,000 access lines (net) during the year ended
December 31, 2011, but added approximately 45,000 HSI subscribers (net) during this same period. With respect to the
access lines we lost in 2011, 368,000 were residential customer lines and 111,000 were business customer lines. We expect
to continue to lose access lines but anticipate partially offsetting those losses with an increase in HSI subscribers during
2012. A substantial further loss of access lines, combined with increased competition and the other factors discussed in
Item 7. Management’s Discussion and Analysis of Financial Condition and Results of Operations, may cause our revenues,
profitability and cash flows to decrease during 2012.
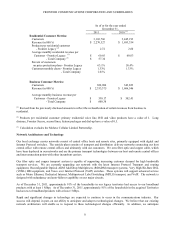
Our Company, like others in the industry, utilizes reporting metrics focused on units. Consistent with our strategy to focus
on the customer, we also utilize residential and business customer metrics that, when combined with unit counts, provides
additional insight into the results of our strategic initiatives described above.