Frontier Communications 2011 Annual Report Download - page 41
Download and view the complete annual report
Please find page 41 of the 2011 Frontier Communications annual report below. You can navigate through the pages in the report by either clicking on the pages listed below, or by using the keyword search tool below to find specific information within the annual report.-
 1
1 -
2
-
3
-
4
-
5
-
6
-
7
-
8
-
9
-
10
-
11
-
12
-
13
-
14
-
15
-
16
-
17
-
18
-
19
-
20
-
21
-
22
-
23
-
24
-
25
-
26
-
27
-
28
-
29
-
30
-
 31
31 -
 32
32 -
 33
33 -
 34
34 -
 35
35 -
 36
36 -
 37
37 -
 38
38 -
 39
39 -
 40
40 -
 41
41 -
 42
42 -
 43
43 -
 44
44 -
 45
45 -
 46
46 -
 47
47 -
 48
48 -
 49
49 -
 50
50 -
 51
51 -
52
-
53
-
54
-
55
-
56
-
57
-
58
-
59
-
60
-
61
-
62
-
63
-
64
-
65
-
66
-
67
-
68
-
69
-
70
-
71
-
72
-
73
-
74
-
75
-
76
-
77
-
78
-
79
-
80
-
81
-
82
-
83
-
84
-
85
-
86
-
87
-
88
-
89
-
90
-
91
-
92
-
93
-
94
-
95
-
96
-
97
-
98
-
99
-
100
-
101
-
102
-
103
-
104
-
105
 |
 |

FRONTIER COMMUNICATIONS CORPORATION AND SUBSIDIARIES
38
we periodically reassess the useful lives of our tangible and intangible assets to determine whether any changes are required.
In 2011 and 2010, we had no “critical estimates” related to asset impairments.
Intangibles
Our indefinite lived intangibles consist of goodwill and trade name, which resulted from the purchase of ILEC properties. We
test for impairment of these assets annually, or more frequently, as circumstances warrant. We test for goodwill impairment
at the “operating segment” level, as that term is defined in U.S. GAAP. Effective with the third quarter of 2011, the Company
reorganized into six operating segments in order to leverage the full benefits of its local engagement model. The six operating
segments consist of the following regions: National, Northeast, Southeast, Central, Midwest and West. Our operating
segments are aggregated into one reportable segment since they have similar economic characteristics. In conjunction with
the reorganization of our operating segments effective with the third quarter of 2011, we reassigned goodwill to our reporting
units using a relative fair value allocation approach. This structure is consistent with how our Chief Operating Decision
Makers (CEO, CFO, COO) review our results on a daily, weekly and monthly basis. After making the change in our operating
segments, we reviewed our goodwill impairment test by comparing the EBITDA multiples for each reporting unit to their
carrying values noting that no impairment indicator was present. No potential impairment was indicated and no further
analysis was deemed necessary.
Our annual goodwill impairment testing date is December 31. Each of the operating segments is also a reporting unit. The
first step in the goodwill impairment test compares the carrying value of net assets of the reporting unit to its fair value. The
result of this first step indicated that fair value of each reporting unit exceeded the carrying value of such reporting units. As
a result, the second step of the goodwill impairment test was not required.
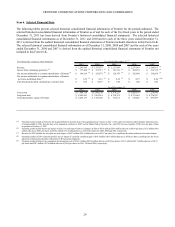
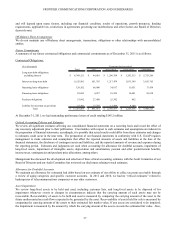
Goodwill by reporting unit (operating segment) at December 31, 2011 is as follows:
($ in thousands) East Southeast West Central National Midwest
Goodwill 1,245,414$ 1,113,931$ 1,072,499$ 1,006,132$ 1,176,139$ 723,604$
Reporting Units
Enterprise values for rural ILEC properties are typically quoted as a multiple of cash flow or EBITDA. Marketplace company
comparisons and analyst reports support a range of values around a multiple of 5.5 to 7.5 times annualized EBITDA. For the
purpose of the goodwill impairment test we define EBITDA as operating income, net of acquisition and integration costs,
non-cash pension/OPEB costs and severance and early retirement costs, plus depreciation and amortization. We determined
the fair value estimates using 6.5 times EBITDA but also used lower EBITDA multiples to gauge the sensitivity of the
estimate and its effect on the margin of excess of fair value over the carrying values of the reporting units. Total fair value
determined in this manner is then allocated to the reporting units based upon each unit’s relative share of consolidated
EBITDA. Our method of determining fair value has been consistently applied for the three years ending December 31, 2011.
Depreciation and Amortization
The calculation of depreciation and amortization expense is based upon the estimated useful lives of the underlying property,
plant and equipment and identifiable intangible assets. Depreciation expense is principally based on the composite group
method for substantially all of our property, plant and equipment assets. Given the varying estimated useful lives of our
property, plant and equipment assets, the Company utilizes multiple asset categories with separately determined composite
lives and individual depreciation rates for each asset category.
Within the composite group method, we group individual assets, including cable and wire, into asset categories utilizing
homogeneous characteristics, where such assets (i) are principally used in the same manner throughout the company, (ii) are
subject to similar operating conditions and (iii) have similar estimated useful lives. Examples of the asset categories we
utilize include aerial cable-copper, aerial cable-fiber, aerial cable-station connections, underground cable-copper and
underground cable-fiber. As a result of continuing changes in technology, an independent study is conducted annually to
update the estimated remaining useful lives of all individual asset categories. The annual study includes models that consider
actual usage, replacement history and certain assumptions about technology evolution to estimate the remaining useful lives
of our asset base by asset category. An independent study was performed in 2010 to determine the estimated remaining useful
lives for our Acquired Business and these new lives were adopted effective July 1, 2010, the acquisition date for those assets.
We revised our estimated remaining useful lives for Frontier legacy plant assets, effective October 1, 2010. The composite
depreciation rate for 2010 for our property, plant and equipment assets was 7.6%, as a result of this study. There have been no
significant changes to the ranges of estimated useful lives for the individual asset categories, including the cable and wire