Frontier Communications 2011 Annual Report Download - page 6
Download and view the complete annual report
Please find page 6 of the 2011 Frontier Communications annual report below. You can navigate through the pages in the report by either clicking on the pages listed below, or by using the keyword search tool below to find specific information within the annual report.-
 1
1 -
 2
2 -
 3
3 -
 4
4 -
 5
5 -
 6
6 -
 7
7 -
 8
8 -
 9
9 -
 10
10 -
 11
11 -
 12
12 -
 13
13 -
 14
14 -
 15
15 -
 16
16 -
 17
17 -
18
-
19
-
20
-
21
-
22
-
23
-
24
-
25
-
26
-
27
-
28
-
29
-
30
-
31
-
32
-
33
-
34
-
35
-
36
-
37
-
38
-
39
-
40
-
41
-
42
-
43
-
44
-
45
-
46
-
47
-
48
-
49
-
50
-
51
-
52
-
53
-
54
-
55
-
56
-
57
-
58
-
59
-
60
-
61
-
62
-
63
-
64
-
65
-
66
-
67
-
68
-
69
-
70
-
71
-
72
-
73
-
74
-
75
-
76
-
77
-
78
-
79
-
80
-
81
-
82
-
83
-
84
-
85
-
86
-
87
-
88
-
89
-
90
-
91
-
92
-
93
-
94
-
95
-
96
-
97
-
98
-
99
-
100
-
101
-
102
-
103
-
104
-
105
 |
 |
FRONTIER COMMUNICATIONS CORPORATION AND SUBSIDIARIES
3
• Dividend Policy
During 2011, we paid cash dividends at an annual rate of $0.75 per share. Effective February 16, 2012, our
Board of Directors set the annual cash dividend at $0.40 per share. The Board reduced the dividend in order to
strengthen our balance sheet and improve operational and financial flexibility. Future dividend payments will be
made at the discretion of our Board of Directors.
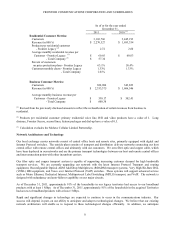
• Customer Revenue
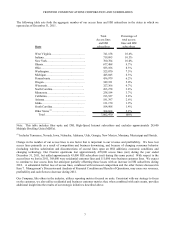
During 2011, our customer revenue from both residential and business customers was $4,623.9 million, including
business revenue of $2,353.4 million and residential revenue of $2,270.5 million. Our average monthly customer
revenue per access line improved by $1.07, or 2%, to $70.10 for the full year of 2011 as compared to the second half
of 2010.
• Customer Retention
During 2011, our rate of access line loss improved to 8.3% for the full year of 2011 as compared to 8.8% for the
second half of 2010, on an annual basis. We believe this is primarily attributable to improvements in customer
service as well as customer recognition of the value of our products, services and bundled options, fewer residential
moves out of territory, fewer moves by businesses to competitors and our ability to compete with cable telephony in
a maturing market place.
• Product Growth
During 2011, we added approximately 45,200 new High-Speed Internet (HSI) subscribers, net. At December 31,
2011, we had approximately 1,764,200 HSI customers. Throughout our properties, we offer a video product through
DISH Network (DISH) and, in addition, we offer fiber optic video services in three states. We added approximately
26,100 video subscribers, net during 2011. At December 31, 2011, we had approximately 557,500 video customers.
• Broadband Expansion
During 2011, we expanded our broadband availability to 415,000 new households, bringing our total to 655,000
since the Transaction. As of December 31, 2011, we had broadband in excess of 1 Mbps available to 83% of the
households in our territory, in excess of 3 Mbps available to 76% of the households in our territory, in excess of 6
Mbps available to 56% of the households in our territory, and in excess of 20 Mbps available to 28% of the
households in our territory.
Communications Services
As of December 31, 2011, we operated as an incumbent local exchange carrier (ILEC) in 27 states.
Our business is with both residential and business customers and we provide the “last mile” of telecommunications services to
customers in these markets. Our services include:
• local and long distance voice services;
• data and Internet services;
• access services; and
• video services.
Competitive Strengths
We believe that we are distinguished by the following competitive strengths:
Enhanced scale and scope. Our increased scale and scope following the Transaction allows us to leverage our common
support functions and systems (such as corporate administrative functions, information technology and network systems)
for both operating expense and capital expenditure synergies. See Management’s Discussion and Analysis of Financial
Condition and Results of Operations (MD&A)—Expected Cost Savings Resulting From the Transaction.