Frontier Communications 2011 Annual Report Download - page 93
Download and view the complete annual report
Please find page 93 of the 2011 Frontier Communications annual report below. You can navigate through the pages in the report by either clicking on the pages listed below, or by using the keyword search tool below to find specific information within the annual report.-
 1
1 -
2
-
3
-
4
-
5
-
6
-
7
-
8
-
9
-
10
-
11
-
12
-
13
-
14
-
15
-
16
-
17
-
18
-
19
-
20
-
21
-
22
-
23
-
24
-
25
-
26
-
27
-
28
-
29
-
30
-
31
-
32
-
33
-
34
-
35
-
36
-
37
-
38
-
39
-
40
-
41
-
42
-
43
-
44
-
45
-
46
-
47
-
48
-
49
-
50
-
51
-
52
-
53
-
54
-
55
-
56
-
57
-
58
-
59
-
60
-
61
-
62
-
63
-
64
-
65
-
66
-
67
-
68
-
69
-
70
-
71
-
72
-
73
-
74
-
75
-
76
-
77
-
78
-
79
-
80
-
81
-
82
-
 83
83 -
 84
84 -
 85
85 -
 86
86 -
 87
87 -
 88
88 -
 89
89 -
 90
90 -
 91
91 -
 92
92 -
 93
93 -
 94
94 -
 95
95 -
 96
96 -
 97
97 -
 98
98 -
 99
99 -
 100
100 -
 101
101 -
 102
102 -
 103
103 -
104
-
105
 |
 |

FRONTIER COMMUNICATIONS CORPORATION AND SUBSIDIARIES
Notes to Consolidated Financial Statements
F-30
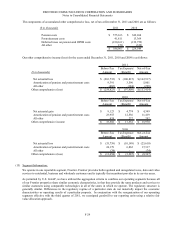
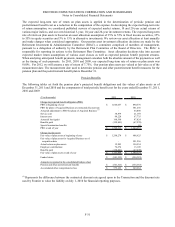
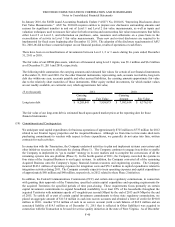
(16) Quarterly Financial Data (Unaudited):
($ in thousands, except per share amounts)
2011 First Quarter Second Quarter Third Quarter Fourth Quarter Total Year
Revenue 1,346,697$ 1,322,255$ 1,290,939$ 1,283,152$ 5,243,043$
Operating income 250,593 238,280 180,291 230,457 899,621
Net income attributable to common shareholders of Frontier 54,711 32,261 20,395 42,247 149,614
Basic and diluted net income per common share
attributable to common shareholders of Frontier 0.05$ 0.03$ 0.02$ 0.04$ 0.15$
2010
Revenue 519,849$ 516,137$ 1,402,968$ 1,358,721$ 3,797,675$
Operating income 161,862 136,411 234,045 239,680 771,998
Net income attributable to common shareholders of Frontier 42,565 35,121 28,995 45,992 152,673
Basic and diluted net income per common share
attributable to common shareholders of Frontier 0.14$ 0.11$ 0.03$ 0.05$ 0.23$
The quarterly net income per common share amounts are rounded to the nearest cent. Annual net income per common
share may vary depending on the effect of such rounding. The change in basic and diluted net income per share during
the third quarter and fourth quarter of 2010 was primarily due to the increase in weighted average shares outstanding as
a result of the issuance of 678.5 million shares in connection with our acquisition of the Acquired Business.
We recognized $13.2 million ($8.2 million or $0.01 per share after tax), $20.3 million ($12.6 million or $0.01 per share
after tax), $67.4 million ($41.6 million or $0.04 per share after tax) and $42.2 million ($26.1 million or $0.03 per share
after tax) of acquisition and integration costs during the first, second, third and fourth quarters of 2011, respectively.
We recognized $10.4 million ($6.5 million or $0.02 per share after tax), $37.0 million ($23.1 million or $0.08 per share
after tax), $78.5 million ($49.1 million or $0.05 per share after tax), and $11.3 million ($7.0 million or $0.01 per share
after tax) of acquisition and integration costs during the first, second, third and fourth quarters of 2010, respectively.
(17) Retirement Plans:
We sponsor a noncontributory defined benefit pension plan covering a significant number of our former and current
employees and other postretirement benefit plans that provide medical, dental, life insurance and other benefits for
covered retired employees and their beneficiaries and covered dependents. The benefits are based on years of service
and final average pay or career average pay. Contributions are made in amounts sufficient to meet ERISA funding
requirements while considering tax deductibility. Plan assets are invested in a diversified portfolio of equity and fixed-
income securities and alternative investments.
The accounting results for pension and other postretirement benefit costs and obligations are dependent upon various
actuarial assumptions applied in the determination of such amounts. These actuarial assumptions include the following:
discount rates, expected long-term rate of return on plan assets, future compensation increases, employee turnover,
healthcare cost trend rates, expected retirement age, optional form of benefit and mortality. We review these
assumptions for changes annually with our independent actuaries. We consider our discount rate and expected long-
term rate of return on plan assets to be our most critical assumptions.
The discount rate is used to value, on a present value basis, our pension and other postretirement benefit obligations as
of the balance sheet date. The same rate is also used in the interest cost component of the pension and postretirement
benefit cost determination for the following year. The measurement date used in the selection of our discount rate is the
balance sheet date. Our discount rate assumption is determined annually with assistance from our independent actuaries
based on the pattern of expected future benefit payments and the prevailing rates available on long-term, high quality
corporate bonds that approximate the benefit obligation. In making this determination we consider, among other things,
the yields on the Citigroup Above-Median Pension Curve, the Towers-Watson Index, the general movement of interest
rates and the changes in those rates from one period to the next. This rate can change from year-to-year based on
market conditions that affect corporate bond yields. Our discount rate was 4.50% at year-end 2011, 5.25% at year-end
2010 and 5.75% at year-end 2009.