Frontier Communications 2011 Annual Report Download - page 45
Download and view the complete annual report
Please find page 45 of the 2011 Frontier Communications annual report below. You can navigate through the pages in the report by either clicking on the pages listed below, or by using the keyword search tool below to find specific information within the annual report.-
 1
1 -
2
-
3
-
4
-
5
-
6
-
7
-
8
-
9
-
10
-
11
-
12
-
13
-
14
-
15
-
16
-
17
-
18
-
19
-
20
-
21
-
22
-
23
-
24
-
25
-
26
-
27
-
28
-
29
-
30
-
31
-
32
-
33
-
34
-
 35
35 -
 36
36 -
 37
37 -
 38
38 -
 39
39 -
 40
40 -
 41
41 -
 42
42 -
 43
43 -
 44
44 -
 45
45 -
 46
46 -
 47
47 -
 48
48 -
 49
49 -
 50
50 -
 51
51 -
 52
52 -
 53
53 -
 54
54 -
 55
55 -
56
-
57
-
58
-
59
-
60
-
61
-
62
-
63
-
64
-
65
-
66
-
67
-
68
-
69
-
70
-
71
-
72
-
73
-
74
-
75
-
76
-
77
-
78
-
79
-
80
-
81
-
82
-
83
-
84
-
85
-
86
-
87
-
88
-
89
-
90
-
91
-
92
-
93
-
94
-
95
-
96
-
97
-
98
-
99
-
100
-
101
-
102
-
103
-
104
-
105
 |
 |

FRONTIER COMMUNICATIONS CORPORATION AND SUBSIDIARIES
42
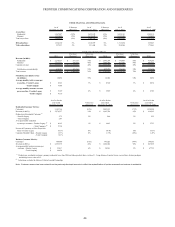
(b) Results of Operations
Effective July 1, 2010, the Company’s scope of operations and balance sheet capitalization changed materially as a result of
the completion of the Transaction. Historical financial and operating data presented for Frontier is not indicative of future
results and includes the results of operations of the Acquired Business from the date of acquisition on July 1, 2010. The
financial discussion and tables below include a comparative analysis of our results of operations on a historical basis for our
Frontier operations as of and for the years ended December 31, 2011, 2010 and 2009, which includes the results of operations
of the Acquired Business for the year ended December 31, 2011, and the six months ended December 31, 2010. The variance
explanations discussed below for the years ended December 31, 2011, 2010 and 2009 include a separate amount for the
additional six months of revenue and operating expenses related to the operating results of the Acquired Business in 2011 and
2010. Certain analyses of revenue and operating expenses may refer to the results of the Frontier legacy operations, which
excludes the Acquired Business.
REVENUE
Revenue is generated primarily through the provision of local, network access, long distance, data, video and internet services.
Such revenues are generated through either a monthly recurring fee or a fee based on usage at a tariffed rate and revenue
recognition is not dependent upon significant judgments by management, with the exception of a determination of a provision for
uncollectible amounts.
Revenue for 2011 increased $1,445.4 million, or 38%, to $5,243.0 million as compared to 2010. Excluding the additional six
months of revenue of $1,667.1 million attributable to the Acquired Business, our revenue for 2011 decreased $221.7 million, or
6% as compared to 2010. This decline in 2011 is a result of decreases in the number of residential and business customers,
switched access, video and other revenue, partially offset by a $32.7 million, or 3%, increase in data and internet services
revenue, each as described in more detail below.
Revenues from data and internet services, such as HSI, for 2011 as compared to 2010 grew and increased as a percentage of total
revenues, and revenues from voice services, like local and long distance services, and from switched access and subsidy
(including federal and state subsidies) declined and decreased as a percentage of our total revenues.
Switched access and subsidy revenue of $619.1 million represented 12% of our revenues for 2011. Switched access revenue was
$319.0 million for 2011, or 6% of our revenues, as compared to $285.5 million for 2010, or 8% of our revenues. Subsidy
revenue was $300.1 million in 2011, or 6% of our revenues, as compared to $212.3 million in 2010, or 6% of our revenues. We
expect declining revenue trends in switched access and subsidy revenue in 2012.
Consolidated revenue for 2010 increased $1,679.8 million, or 79%, to $3,797.7 million as compared to 2009. Excluding the
additional six months of revenue of $1,748.1 million attributable to the Acquired Business, our revenue decreased $68.3 million,
or 3%, as compared to 2009. This decline for our Frontier legacy operations in 2010 is a result of decreases in the number of
residential and business customers, services revenue, switched access revenue, long distance services revenue and directory
revenue, partially offset by a $28.8 million, or 5%, increase in data and internet services revenue, each as described in more detail
below.
Change in the number of our access lines is one metric that is important to our revenue and profitability. We lost access lines
primarily because of changing consumer behavior (including wireless substitution), economic conditions, changing technology,
competition, and by the loss of second lines upon the addition of HSI service. Our Frontier legacy operations lost approximately
117,000 access lines (net) during 2011, or 6% on an annual basis, comparable to the 128,000 access lines (net), or 6% on an
annual basis, lost during 2010. The Acquired Business lost approximately 362,000 access lines (net) during 2011, or 10% on an
annual basis, as compared to the 201,000 access lines (net), or 10% on an annual basis, lost during the six months ended
December 31, 2010. Economic conditions and/or increasing competition could make it more difficult to sell our bundled service
offerings, and cause us to increase our promotions and/or lower our prices for our products and services, which would adversely
affect our revenue, profitability and cash flow.
During 2011, the Company added approximately 45,200 HSI subscribers (net). During the first quarter of 2011, the Company
announced a price increase implemented in April 2011 for FiOS video customers in the state of Indiana who are on month-to-
month plans. While the Company implemented a number of retention promotions, losses of FiOS video customers occurred
during 2011, as did the loss of FiOS data customers, although the absolute number of losses declined throughout the year.