Dollar General 2014 Annual Report Download - page 95
Download and view the complete annual report
Please find page 95 of the 2014 Dollar General annual report below. You can navigate through the pages in the report by either clicking on the pages listed below, or by using the keyword search tool below to find specific information within the annual report.-
 1
1 -
2
-
3
-
4
-
5
-
6
-
7
-
8
-
9
-
10
-
11
-
12
-
13
-
14
-
15
-
16
-
17
-
18
-
19
-
20
-
21
-
22
-
23
-
24
-
25
-
26
-
27
-
28
-
29
-
30
-
31
-
32
-
33
-
34
-
35
-
36
-
37
-
38
-
39
-
40
-
41
-
42
-
43
-
44
-
45
-
46
-
47
-
48
-
49
-
50
-
51
-
52
-
53
-
54
-
55
-
56
-
57
-
58
-
59
-
60
-
61
-
62
-
63
-
64
-
65
-
66
-
67
-
68
-
69
-
70
-
71
-
72
-
73
-
74
-
75
-
76
-
77
-
78
-
79
-
80
-
81
-
82
-
83
-
84
-
 85
85 -
 86
86 -
 87
87 -
 88
88 -
 89
89 -
 90
90 -
 91
91 -
 92
92 -
 93
93 -
 94
94 -
 95
95 -
 96
96 -
 97
97 -
 98
98 -
 99
99 -
 100
100 -
 101
101 -
 102
102 -
 103
103 -
 104
104 -
 105
105 -
106
-
107
-
108
-
109
-
110
-
111
-
112
-
113
-
114
-
115
-
116
-
117
-
118
-
119
-
120
-
121
-
122
-
123
-
124
-
125
-
126
-
127
-
128
-
129
-
130
-
131
-
132
-
133
-
134
-
135
-
136
-
137
-
138
-
139
-
140
-
141
-
142
-
143
-
144
-
145
-
146
-
147
-
148
-
149
-
150
-
151
-
152
-
153
-
154
-
155
-
156
-
157
-
158
-
159
-
160
-
161
-
162
-
163
-
164
-
165
-
166
-
167
-
168
-
169
-
170
-
171
-
172
-
173
-
174
-
175
-
176
-
177
-
178
-
179
-
180
 |
 |

10-K
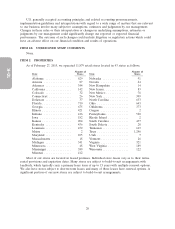
As of February 27, 2015, we operated twelve distribution centers, as described in the following
table:
Year Approximate Square Number of
Location Opened Footage Stores Served
Scottsville, KY ..................... 1959 720,000 800
Ardmore, OK ...................... 1994 1,310,000 1,414
South Boston, VA ................... 1997 1,250,000 906
Indianola, MS ...................... 1998 820,000 873
Fulton, MO ....................... 1999 1,150,000 1,286
Alachua, FL ....................... 2000 980,000 1,019
Zanesville, OH ..................... 2001 1,170,000 1,145
Jonesville, SC ...................... 2005 1,120,000 1,113
Marion, IN ........................ 2006 1,110,000 1,193
Bessemer, AL ...................... 2012 940,000 1,065
Lebec, CA ........................ 2012 600,000 285
Bethel, PA ........................ 2014 1,000,000 780
We lease the distribution centers located in California, Oklahoma, Mississippi and Missouri and
own the other eight distribution centers in the table above. Approximately 7.25 acres of the land on
which our Kentucky distribution center is located is subject to a ground lease. As of January 30, 2015,
we leased approximately 444,000 square feet of additional temporary warehouse space to support our
distribution needs.
Our executive offices are located in approximately 302,000 square feet of owned buildings and
approximately 56,000 square feet of leased office space in Goodlettsville, Tennessee.
ITEM 3. LEGAL PROCEEDINGS
The information contained in Note 8 to the consolidated financial statements under the heading
‘‘Legal proceedings’’ contained in Part II, Item 8 of this report is incorporated herein by this reference.
ITEM 4. MINE SAFETY DISCLOSURES
None.
21