Dollar General 2014 Annual Report Download - page 35
Download and view the complete annual report
Please find page 35 of the 2014 Dollar General annual report below. You can navigate through the pages in the report by either clicking on the pages listed below, or by using the keyword search tool below to find specific information within the annual report.
Proxy
25MAR201519511740 25MAR201519511872
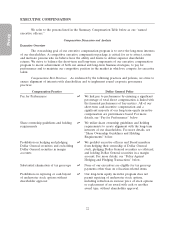
Compensation Practice Dollar General Policy
Annual compensation risk assessment ឡOur Compensation Committee performs at least
annually a risk assessment of our compensation
program.
Independent compensation consultant ឡThe Compensation Committee retains an independent
compensation consultant to advise the Compensation
Committee on the executive and non-employee
director compensation program and practices.
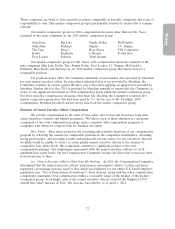
Pay for Performance. Consistent with our pay-for-performance philosophy, a significant
majority of our named executive officers’ target total direct compensation for 2014 was performance
based and exposed to fluctuations in the price of our common stock. In addition, our 2014 target total
direct compensation packages sought to reward both long-term and annual performance, as shown in
the charts below:
CEO Other NEOs
(Average)
Salary
14.05%
STI
18.27%
LTI
67.68%
Variable/At-Risk: 85.95%
Salary
29.38%
STI
20.30%
LTI
50.32%
Variable/At-Risk: 70.62%
STI—Short-Term Cash Incentive
LTI—Long-Term Equity Incentive
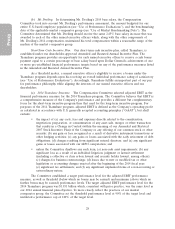
The results of the financial performance metrics used in connection with our 2014
performance-based compensation are as follows:
• Adjusted EBITDA was $2.175 billion (versus $2.09 billion in 2013) and Adjusted ROIC
was 19.50% (versus 19.89% in 2013), in each case as defined and calculated for purposes
of our outstanding performance share unit awards, resulting in the performance share units
granted in March 2014 being earned at 95.10% of target.
• Adjusted EBIT, as defined and calculated for purposes of our annual Teamshare bonus
program, was $1.795 billion (96.97% of the target) compared to $1.742 billion (94.2% of
target) in 2013, resulting in a 2014 Teamshare payout to participants at 84.84% of target.
• Adjusted EPS, as defined and calculated for purposes of Mr. Dreiling’s performance-based
restricted stock award granted in 2012, exceeded the 2014 target of $3.61 per share,
resulting in the vesting of the first tranche of such award.
Significant Compensation-Related Actions in 2014. We make various changes to our
compensation program in the normal course in order to remain competitive and further strengthen our
program in ways that support our shareholders’ interests. The most significant compensation-related
actions in 2014 pertaining to our named executive officers include:
23


