Dollar General 2014 Annual Report Download - page 158
Download and view the complete annual report
Please find page 158 of the 2014 Dollar General annual report below. You can navigate through the pages in the report by either clicking on the pages listed below, or by using the keyword search tool below to find specific information within the annual report.-
 1
1 -
2
-
3
-
4
-
5
-
6
-
7
-
8
-
9
-
10
-
11
-
12
-
13
-
14
-
15
-
16
-
17
-
18
-
19
-
20
-
21
-
22
-
23
-
24
-
25
-
26
-
27
-
28
-
29
-
30
-
31
-
32
-
33
-
34
-
35
-
36
-
37
-
38
-
39
-
40
-
41
-
42
-
43
-
44
-
45
-
46
-
47
-
48
-
49
-
50
-
51
-
52
-
53
-
54
-
55
-
56
-
57
-
58
-
59
-
60
-
61
-
62
-
63
-
64
-
65
-
66
-
67
-
68
-
69
-
70
-
71
-
72
-
73
-
74
-
75
-
76
-
77
-
78
-
79
-
80
-
81
-
82
-
83
-
84
-
85
-
86
-
87
-
88
-
89
-
90
-
91
-
92
-
93
-
94
-
95
-
96
-
97
-
98
-
99
-
100
-
101
-
102
-
103
-
104
-
105
-
106
-
107
-
108
-
109
-
110
-
111
-
112
-
113
-
114
-
115
-
116
-
117
-
118
-
119
-
120
-
121
-
122
-
123
-
124
-
125
-
126
-
127
-
128
-
129
-
130
-
131
-
132
-
133
-
134
-
135
-
136
-
137
-
138
-
139
-
140
-
141
-
142
-
143
-
144
-
145
-
146
-
147
-
 148
148 -
 149
149 -
 150
150 -
 151
151 -
 152
152 -
 153
153 -
 154
154 -
 155
155 -
 156
156 -
 157
157 -
 158
158 -
 159
159 -
 160
160 -
 161
161 -
 162
162 -
 163
163 -
 164
164 -
 165
165 -
 166
166 -
 167
167 -
 168
168 -
169
-
170
-
171
-
172
-
173
-
174
-
175
-
176
-
177
-
178
-
179
-
180
 |
 |

10-K
DOLLAR GENERAL CORPORATION AND SUBSIDIARIES
NOTES TO CONSOLIDATED FINANCIAL STATEMENTS (Continued)
10. Share-based payments (Continued)
The weighted average for key assumptions used in determining the fair value of all stock options
granted in the years ended January 30, 2015, January 31, 2014, and February 1, 2013, and a summary of
the methodology applied to develop each assumption, are as follows:
January 30, January 31, February 1,
2015 2014 2013
Expected dividend yield ................... 0% 0% 0%
Expected stock price volatility .............. 25.6% 26.2% 26.8%
Weighted average risk-free interest rate ....... 1.9% 1.2% 1.5%
Expected term of options (years) ............ 6.3 6.3 6.3
Expected dividend yield—This is an estimate of the expected dividend yield on the Company’s
stock. An increase in the dividend yield will decrease compensation expense.
Expected stock price volatility—This is a measure of the amount by which the price of the
Company’s common stock has fluctuated or is expected to fluctuate. Since November 2011, the
expected volatilities for awards have been based on the historical volatility of the Company’s publicly
traded common stock. An increase in the expected volatility will increase compensation expense.
Weighted average risk-free interest rate—This is the U.S. Treasury rate for the week of the grant
having a term approximating the expected life of the option. An increase in the risk-free interest rate
will increase compensation expense.
Expected term of options—This is the period of time over which the options granted are expected
to remain outstanding. The Company has estimated the expected term as the mid-point between the
vesting date and the contractual term of the option. An increase in the expected term will increase
compensation expense.
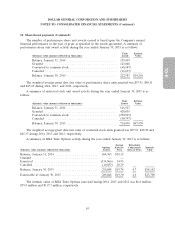
A summary of the Company’s stock option activity, exclusive of options subject to an MSA, during
the year ended January 30, 2015 is as follows:
Remaining
Options Average Contractual Intrinsic
(Intrinsic value amounts reflected in thousands) Issued Exercise Price Term in Years Value
Balance, January 31, 2014 .................... 1,840,542 $45.26
Granted ................................. 898,817 58.03
Exercised ................................ (159,205) 44.52
Canceled ................................. (181,030) 50.55
Balance, January 30, 2015 .................... 2,399,124 $49.69 8.1 $41,661
Exercisable at January 30, 2015 ................ 633,841 $42.43 7.0 $15,613
The weighted average grant date fair value of non-MSA options was $17.26, $13.86 and $13.54
during 2014, 2013 and 2012, respectively. The intrinsic value of non-MSA options exercised during
2014, 2013, and 2012 was $2.5 million, $0.8 million and $0.3 million, respectively.
84