Dollar General 2014 Annual Report Download - page 133
Download and view the complete annual report
Please find page 133 of the 2014 Dollar General annual report below. You can navigate through the pages in the report by either clicking on the pages listed below, or by using the keyword search tool below to find specific information within the annual report.-
 1
1 -
2
-
3
-
4
-
5
-
6
-
7
-
8
-
9
-
10
-
11
-
12
-
13
-
14
-
15
-
16
-
17
-
18
-
19
-
20
-
21
-
22
-
23
-
24
-
25
-
26
-
27
-
28
-
29
-
30
-
31
-
32
-
33
-
34
-
35
-
36
-
37
-
38
-
39
-
40
-
41
-
42
-
43
-
44
-
45
-
46
-
47
-
48
-
49
-
50
-
51
-
52
-
53
-
54
-
55
-
56
-
57
-
58
-
59
-
60
-
61
-
62
-
63
-
64
-
65
-
66
-
67
-
68
-
69
-
70
-
71
-
72
-
73
-
74
-
75
-
76
-
77
-
78
-
79
-
80
-
81
-
82
-
83
-
84
-
85
-
86
-
87
-
88
-
89
-
90
-
91
-
92
-
93
-
94
-
95
-
96
-
97
-
98
-
99
-
100
-
101
-
102
-
103
-
104
-
105
-
106
-
107
-
108
-
109
-
110
-
111
-
112
-
113
-
114
-
115
-
116
-
117
-
118
-
119
-
120
-
121
-
122
-
 123
123 -
 124
124 -
 125
125 -
 126
126 -
 127
127 -
 128
128 -
 129
129 -
 130
130 -
 131
131 -
 132
132 -
 133
133 -
 134
134 -
 135
135 -
 136
136 -
 137
137 -
 138
138 -
 139
139 -
 140
140 -
 141
141 -
 142
142 -
 143
143 -
144
-
145
-
146
-
147
-
148
-
149
-
150
-
151
-
152
-
153
-
154
-
155
-
156
-
157
-
158
-
159
-
160
-
161
-
162
-
163
-
164
-
165
-
166
-
167
-
168
-
169
-
170
-
171
-
172
-
173
-
174
-
175
-
176
-
177
-
178
-
179
-
180
 |
 |

10-K
DOLLAR GENERAL CORPORATION AND SUBSIDIARIES
NOTES TO CONSOLIDATED FINANCIAL STATEMENTS (Continued)
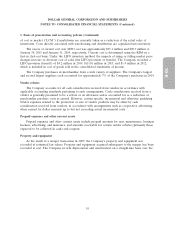
1. Basis of presentation and accounting policies (Continued)
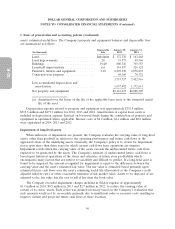
The Company recognizes contingent rental expense when the achievement of specified sales targets
is considered probable. The amount expensed but not paid as of January 30, 2015 and January 31, 2014
was approximately $4.8 million and $6.0 million, respectively, and is included in Accrued expenses and
other in the consolidated balance sheets.
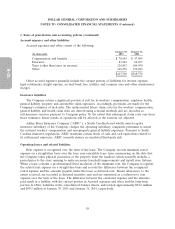
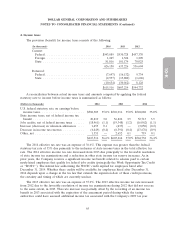
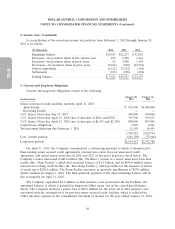
Other liabilities
Noncurrent Other liabilities consist of the following:
January 30, January 31,
(In thousands) 2015 2014
Compensation and benefits ......................... $ 20,266 $ 17,604
Insurance ...................................... 140,916 145,162
Income tax related reserves ......................... 10,690 18,802
Deferred gain on sale leaseback ...................... 58,215 62,693
Other ......................................... 55,222 52,285
$285,309 $296,546
Amounts categorized as ‘‘Other’’ in the table above consist primarily of deferred rent.
Fair value accounting
The Company utilizes accounting standards for fair value, which include the definition of fair
value, the framework for measuring fair value, and disclosures about fair value measurements. Fair
value is a market-based measurement, not an entity-specific measurement. Therefore, a fair value
measurement should be determined based on the assumptions that market participants would use in
pricing the asset or liability. As a basis for considering market participant assumptions in fair value
measurements, fair value accounting standards establish a fair value hierarchy that distinguishes
between market participant assumptions based on market data obtained from sources independent of
the reporting entity (observable inputs that are classified within Levels 1 and 2 of the hierarchy) and
the reporting entity’s own assumptions about market participant assumptions (unobservable inputs
classified within Level 3 of the hierarchy).
Level 1 inputs utilize quoted prices (unadjusted) in active markets for identical assets or liabilities
that the Company has the ability to access. Level 2 inputs are inputs other than quoted prices included
in Level 1 that are directly or indirectly observable for the asset or liability. Level 2 inputs may include
quoted prices for similar assets and liabilities in active markets, as well as inputs that are observable for
the asset or liability (other than quoted prices), such as interest rates, foreign exchange rates, and yield
curves that are observable at commonly quoted intervals. Level 3 inputs are unobservable inputs for the
asset or liability, which are based on an entity’s own assumptions, as there is little, if any, observable
market activity. In instances where the fair value measurement is based on inputs from different levels
of the fair value hierarchy, the level in the fair value hierarchy within which the entire fair value
measurement falls is based on the lowest level input that is significant to the fair value measurement in
its entirety. The Company’s assessment of the significance of a particular input to the fair value
measurement in its entirety requires judgment and considers factors specific to the asset or liability.
59