Dollar General 2014 Annual Report Download - page 140
Download and view the complete annual report
Please find page 140 of the 2014 Dollar General annual report below. You can navigate through the pages in the report by either clicking on the pages listed below, or by using the keyword search tool below to find specific information within the annual report.-
 1
1 -
2
-
3
-
4
-
5
-
6
-
7
-
8
-
9
-
10
-
11
-
12
-
13
-
14
-
15
-
16
-
17
-
18
-
19
-
20
-
21
-
22
-
23
-
24
-
25
-
26
-
27
-
28
-
29
-
30
-
31
-
32
-
33
-
34
-
35
-
36
-
37
-
38
-
39
-
40
-
41
-
42
-
43
-
44
-
45
-
46
-
47
-
48
-
49
-
50
-
51
-
52
-
53
-
54
-
55
-
56
-
57
-
58
-
59
-
60
-
61
-
62
-
63
-
64
-
65
-
66
-
67
-
68
-
69
-
70
-
71
-
72
-
73
-
74
-
75
-
76
-
77
-
78
-
79
-
80
-
81
-
82
-
83
-
84
-
85
-
86
-
87
-
88
-
89
-
90
-
91
-
92
-
93
-
94
-
95
-
96
-
97
-
98
-
99
-
100
-
101
-
102
-
103
-
104
-
105
-
106
-
107
-
108
-
109
-
110
-
111
-
112
-
113
-
114
-
115
-
116
-
117
-
118
-
119
-
120
-
121
-
122
-
123
-
124
-
125
-
126
-
127
-
128
-
129
-
 130
130 -
 131
131 -
 132
132 -
 133
133 -
 134
134 -
 135
135 -
 136
136 -
 137
137 -
 138
138 -
 139
139 -
 140
140 -
 141
141 -
 142
142 -
 143
143 -
 144
144 -
 145
145 -
 146
146 -
 147
147 -
 148
148 -
 149
149 -
 150
150 -
151
-
152
-
153
-
154
-
155
-
156
-
157
-
158
-
159
-
160
-
161
-
162
-
163
-
164
-
165
-
166
-
167
-
168
-
169
-
170
-
171
-
172
-
173
-
174
-
175
-
176
-
177
-
178
-
179
-
180
 |
 |

10-K
DOLLAR GENERAL CORPORATION AND SUBSIDIARIES
NOTES TO CONSOLIDATED FINANCIAL STATEMENTS (Continued)
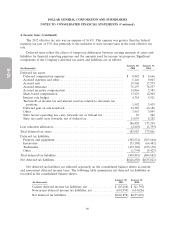
4. Income taxes (Continued)
The 2012 effective tax rate was an expense of 36.4%. This expense was greater than the federal
statutory tax rate of 35% due primarily to the inclusion of state income taxes in the total effective tax
rate.
Deferred taxes reflect the effects of temporary differences between carrying amounts of assets and
liabilities for financial reporting purposes and the amounts used for income tax purposes. Significant
components of the Company’s deferred tax assets and liabilities are as follows:
January 30, January 31,
(In thousands) 2015 2014
Deferred tax assets:
Deferred compensation expense ................................. $ 8,842 $ 8,666
Accrued expenses and other .................................... 5,146 9,067
Accrued rent ............................................... 19,360 17,375
Accrued insurance ........................................... 76,197 78,557
Accrued incentive compensation ................................. 14,866 3,385
Share based compensation ..................................... 17,623 12,049
Interest rate hedges .......................................... 4,318 4,921
Tax benefit of income tax and interest reserves related to uncertain tax
positions ................................................ 1,502 3,439
Deferred gain on sale-leaseback ................................. 24,385 26,186
Other .................................................... 3,463 3,045
State tax net operating loss carry forwards, net of federal tax ............ 87 282
State tax credit carry forwards, net of federal tax ..................... 11,039 8,282
186,828 175,254
Less valuation allowances ....................................... (2,845) (1,393)
Total deferred tax assets ........................................ 183,983 173,861
Deferred tax liabilities:
Property and equipment ....................................... (302,531) (307,644)
Inventories ................................................ (73,188) (64,481)
Trademarks ................................................ (433,328) (433,130)
Other .................................................... (1,794) (4,427)
Total deferred tax liabilities ...................................... (810,841) (809,682)
Net deferred tax liabilities ....................................... $(626,858) $(635,821)
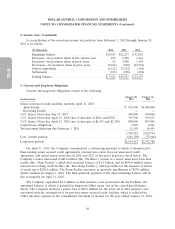
Net deferred tax liabilities are reflected separately on the consolidated balance sheets as current
and noncurrent deferred income taxes. The following table summarizes net deferred tax liabilities as
recorded in the consolidated balance sheets:
January 30, January 31,
(In thousands) 2015 2014
Current deferred income tax liabilities, net .............. $ (25,268) $ (21,795)
Noncurrent deferred income tax liabilities, net ........... (601,590) (614,026)
Net deferred tax liabilities .......................... $(626,858) $(635,821)
66