Dollar General 2014 Annual Report Download - page 109
Download and view the complete annual report
Please find page 109 of the 2014 Dollar General annual report below. You can navigate through the pages in the report by either clicking on the pages listed below, or by using the keyword search tool below to find specific information within the annual report.-
 1
1 -
2
-
3
-
4
-
5
-
6
-
7
-
8
-
9
-
10
-
11
-
12
-
13
-
14
-
15
-
16
-
17
-
18
-
19
-
20
-
21
-
22
-
23
-
24
-
25
-
26
-
27
-
28
-
29
-
30
-
31
-
32
-
33
-
34
-
35
-
36
-
37
-
38
-
39
-
40
-
41
-
42
-
43
-
44
-
45
-
46
-
47
-
48
-
49
-
50
-
51
-
52
-
53
-
54
-
55
-
56
-
57
-
58
-
59
-
60
-
61
-
62
-
63
-
64
-
65
-
66
-
67
-
68
-
69
-
70
-
71
-
72
-
73
-
74
-
75
-
76
-
77
-
78
-
79
-
80
-
81
-
82
-
83
-
84
-
85
-
86
-
87
-
88
-
89
-
90
-
91
-
92
-
93
-
94
-
95
-
96
-
97
-
98
-
 99
99 -
 100
100 -
 101
101 -
 102
102 -
 103
103 -
 104
104 -
 105
105 -
 106
106 -
 107
107 -
 108
108 -
 109
109 -
 110
110 -
 111
111 -
 112
112 -
 113
113 -
 114
114 -
 115
115 -
 116
116 -
 117
117 -
 118
118 -
 119
119 -
120
-
121
-
122
-
123
-
124
-
125
-
126
-
127
-
128
-
129
-
130
-
131
-
132
-
133
-
134
-
135
-
136
-
137
-
138
-
139
-
140
-
141
-
142
-
143
-
144
-
145
-
146
-
147
-
148
-
149
-
150
-
151
-
152
-
153
-
154
-
155
-
156
-
157
-
158
-
159
-
160
-
161
-
162
-
163
-
164
-
165
-
166
-
167
-
168
-
169
-
170
-
171
-
172
-
173
-
174
-
175
-
176
-
177
-
178
-
179
-
180
 |
 |

10-K
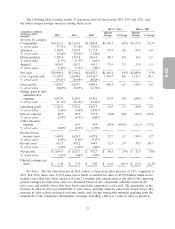
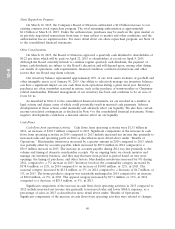
decrease in SG&A expense as a percentage of sales. The above items were partially offset by certain
costs that increased from 2012 to 2013 at a rate higher than our increase in sales, including
depreciation and amortization and fees associated with the increased volume of customer purchases
transacted with debit cards.
Interest Expense. Interest expense remained relatively constant in 2014 compared to 2013. See the
detailed discussion under ‘‘Liquidity and Capital Resources’’ regarding the financing of various
long-term obligations and the related effect on interest expense in the periods presented.
The decrease in interest expense in 2013 compared to 2012 is due to lower all-in interest rates
primarily resulting from the completion of a refinancing in April 2013.
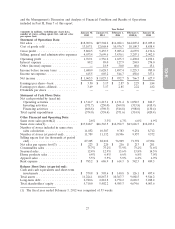
We had outstanding variable-rate debt of $62.0 million and $139.5 million as of January 30, 2015
and January 31, 2014, respectively, after taking into consideration the impact of interest rate swaps. The
remainder of our outstanding indebtedness at January 30, 2015 and January 31, 2014 was fixed rate
debt.
Other (Income) Expense. In 2013, we recorded pretax losses of $18.9 million resulting from the
termination of our senior secured credit facilities. In 2012, we recorded pretax losses of $29.0 million
resulting from the redemption of $450.7 million aggregate principal amount of our senior subordinated
notes due 2017 plus accrued and unpaid interest.
Income Taxes. The effective income tax rates for 2014, 2013, and 2012 were expenses of 36.6%,
37.0%, and 36.4%, respectively.
The effective income tax rate for 2014 was 36.6% compared to a rate of 37.0% for 2013 which
represents a net decrease of 0.4 percentage points. The effective income tax rate decreased from 2013
due principally to the favorable resolution of state income tax examinations and other state income tax
reserves, which increased by a lesser amount in 2014 compared to 2013. As in prior years, we receive a
significant income tax benefit related to wages paid to certain newly hired employees that qualify for
federal jobs credits (principally the Work Opportunity Tax Credit or ‘‘WOTC’’). The federal law
authorizing the WOTC credit has expired for employees hired after December 31, 2014. In the past,
when these credit provisions have expired, Congress has reenacted the law on a retroactive basis. It is
uncertain as to whether (or when) WOTC credits will be retroactively renewed in this instance. The
Company will receive credits in future periods for employees hired on or before December 31, 2014;
however, the future period credit received will be significantly lower than what has been recognized in
2014 and prior years without WOTC reenactment.
The effective income tax rate for 2013 was 37.0% compared to a rate of 36.4% for 2012 which
represents a net increase of 0.6 percentage points. The 2012 amounts were favorably impacted by the
resolution of income tax examinations that did not reoccur, to the same extent, in 2013. This effective
tax rate increase was partially offset by the recording of an income tax benefit in 2013 associated with
the expiration of the assessment period during which the taxing authorities could have assessed
additional income tax associated with our 2009 tax year. In addition, 2013 reflects larger income tax
benefits associated with federal jobs credits.
The 2012 effective tax rate of 36.4% was greater than the statutory tax rate of 35% due primarily
to the inclusion of state income taxes in the total effective tax rate.
Off Balance Sheet Arrangements
The entities involved in the ownership structure underlying the leases for three of our distribution
centers meet the accounting definition of a Variable Interest Entity (‘‘VIE’’). One of these distribution
centers has been recorded as a financing obligation whereby its property and equipment are reflected
in our consolidated balance sheets. The land and buildings of the other two distribution centers have
been recorded as operating leases. We are not the primary beneficiary of these VIEs and, accordingly,
have not included these entities in our consolidated financial statements. Other than the foregoing, we
are not party to any material off balance sheet arrangements.
35