Dollar General 2014 Annual Report Download - page 104
Download and view the complete annual report
Please find page 104 of the 2014 Dollar General annual report below. You can navigate through the pages in the report by either clicking on the pages listed below, or by using the keyword search tool below to find specific information within the annual report.-
 1
1 -
2
-
3
-
4
-
5
-
6
-
7
-
8
-
9
-
10
-
11
-
12
-
13
-
14
-
15
-
16
-
17
-
18
-
19
-
20
-
21
-
22
-
23
-
24
-
25
-
26
-
27
-
28
-
29
-
30
-
31
-
32
-
33
-
34
-
35
-
36
-
37
-
38
-
39
-
40
-
41
-
42
-
43
-
44
-
45
-
46
-
47
-
48
-
49
-
50
-
51
-
52
-
53
-
54
-
55
-
56
-
57
-
58
-
59
-
60
-
61
-
62
-
63
-
64
-
65
-
66
-
67
-
68
-
69
-
70
-
71
-
72
-
73
-
74
-
75
-
76
-
77
-
78
-
79
-
80
-
81
-
82
-
83
-
84
-
85
-
86
-
87
-
88
-
89
-
90
-
91
-
92
-
93
-
 94
94 -
 95
95 -
 96
96 -
 97
97 -
 98
98 -
 99
99 -
 100
100 -
 101
101 -
 102
102 -
 103
103 -
 104
104 -
 105
105 -
 106
106 -
 107
107 -
 108
108 -
 109
109 -
 110
110 -
 111
111 -
 112
112 -
 113
113 -
 114
114 -
115
-
116
-
117
-
118
-
119
-
120
-
121
-
122
-
123
-
124
-
125
-
126
-
127
-
128
-
129
-
130
-
131
-
132
-
133
-
134
-
135
-
136
-
137
-
138
-
139
-
140
-
141
-
142
-
143
-
144
-
145
-
146
-
147
-
148
-
149
-
150
-
151
-
152
-
153
-
154
-
155
-
156
-
157
-
158
-
159
-
160
-
161
-
162
-
163
-
164
-
165
-
166
-
167
-
168
-
169
-
170
-
171
-
172
-
173
-
174
-
175
-
176
-
177
-
178
-
179
-
180
 |
 |

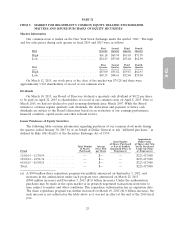
10-K
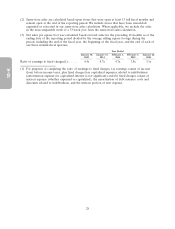
labor dispute on the U.S. west coast all contributed to a decrease in our overall gross profit rate in
2014. We believe that both tobacco and perishables are significant drivers of customer traffic that
should lead to increases in average purchase amount. We expect the improvement in our net sales from
these initiatives will outweigh the corresponding reduction in our gross profit rate. In addition, we have
ongoing efforts to reduce product costs including shrink reduction, effective category management,
utilization of private brands, distribution and transportation efficiencies and additional improvements to
our pricing and markdown business model, among others, while remaining committed to our everyday
low price strategy. In our consumables category, we strive to offer the optimal balance of the most
popular nationally advertised brands and our own private brands, which generally have higher gross
profit rates than national brands. We believe that our core customer is continuing to seek out and
purchase goods at entry level price points and is doing so with greater frequency. To this end, we
increased our offering of $1 food items and the number of offerings from our Smart & Simple brand.
Commodities cost inflation was minimal in 2014 and, in some instances, we experienced a decrease in
such costs. Accordingly, overall price increases passed through to our customers were minimal. We have
seen positive results from our home and apparel segments, and remain committed to all of our
non-consumables categories, including seasonal. We expect the growth of consumables to continue to
outpace the non-consumables categories again in 2015, albeit to a lesser degree than in recent years,
due in part to the anticipated continued economic pressures discussed above.
Our third priority is leveraging process improvements and information technology to reduce costs.
We are committed as an organization to reduce costs, particularly selling, general and administrative
expenses (‘‘SG&A’’) that do not affect the customer experience. In 2014, our financial results reflect a
significant increase in incentive compensation expense, as the 2013 threshold financial performance
level required under our annual cash incentive compensation program was not met. Additionally, rent
and utilities costs contributed to the increase in SG&A. Conversely, we again successfully lowered our
store labor costs as a percentage of sales, in part, by simplifying various tasks performed in the stores.
Going forward, we will continue to simplify or eliminate unnecessary work and optimize labor in our
stores and elsewhere in the company. Additional items that were lower as a percentage of sales include
workers’ compensation and general liability expenses.
Our fourth priority is to strengthen and expand Dollar General’s culture of serving others. For
customers this means helping them ‘‘Save time. Save money. Every day!’’ by providing clean,
well-stocked stores with quality products at low prices. For employees, this means creating an
environment that attracts and retains key employees throughout the organization. For the public, this
means giving back to our store communities through our charitable and other efforts. For shareholders,
this means meeting their expectations of an efficiently and profitably run organization that operates
with compassion and integrity.
Our continued focus on these four priorities, coupled with strong cash flow management and share
repurchases, resulted in solid overall operating and financial performance in 2014 as compared to 2013
as follows. Basis points, as referred to below, are equal to 0.01 percent of total sales.
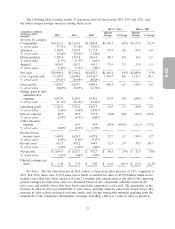
• Net sales in 2014 increased 8.0% over 2013. Sales in same-stores increased 2.8%, with increases
in both customer traffic and average transaction amount. Consumables represented 76% of sales
in 2014 and drove 82% of the total increase. Departments with the most significant increases
were tobacco, perishables and candy and snacks. Average sales per square foot in 2014 were
$223, up from $220 in 2013.
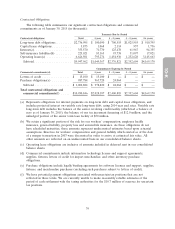
• Operating profit increased 1.9% to $1.77 billion, or 9.4% of sales, compared to $1.74 billion, or
9.9% of sales in 2013. The decrease in our operating profit rate was attributable to a 36 basis-
point decrease in our gross profit rate, coupled with a 19 basis-point increase in SG&A.
30