Dollar General 2014 Annual Report Download - page 43
Download and view the complete annual report
Please find page 43 of the 2014 Dollar General annual report below. You can navigate through the pages in the report by either clicking on the pages listed below, or by using the keyword search tool below to find specific information within the annual report.-
 1
1 -
2
-
3
-
4
-
5
-
6
-
7
-
8
-
9
-
10
-
11
-
12
-
13
-
14
-
15
-
16
-
17
-
18
-
19
-
20
-
21
-
22
-
23
-
24
-
25
-
26
-
27
-
28
-
29
-
30
-
31
-
32
-
 33
33 -
 34
34 -
 35
35 -
 36
36 -
 37
37 -
 38
38 -
 39
39 -
 40
40 -
 41
41 -
 42
42 -
 43
43 -
 44
44 -
 45
45 -
 46
46 -
 47
47 -
 48
48 -
 49
49 -
 50
50 -
 51
51 -
 52
52 -
 53
53 -
54
-
55
-
56
-
57
-
58
-
59
-
60
-
61
-
62
-
63
-
64
-
65
-
66
-
67
-
68
-
69
-
70
-
71
-
72
-
73
-
74
-
75
-
76
-
77
-
78
-
79
-
80
-
81
-
82
-
83
-
84
-
85
-
86
-
87
-
88
-
89
-
90
-
91
-
92
-
93
-
94
-
95
-
96
-
97
-
98
-
99
-
100
-
101
-
102
-
103
-
104
-
105
-
106
-
107
-
108
-
109
-
110
-
111
-
112
-
113
-
114
-
115
-
116
-
117
-
118
-
119
-
120
-
121
-
122
-
123
-
124
-
125
-
126
-
127
-
128
-
129
-
130
-
131
-
132
-
133
-
134
-
135
-
136
-
137
-
138
-
139
-
140
-
141
-
142
-
143
-
144
-
145
-
146
-
147
-
148
-
149
-
150
-
151
-
152
-
153
-
154
-
155
-
156
-
157
-
158
-
159
-
160
-
161
-
162
-
163
-
164
-
165
-
166
-
167
-
168
-
169
-
170
-
171
-
172
-
173
-
174
-
175
-
176
-
177
-
178
-
179
-
180
 |
 |

Proxy
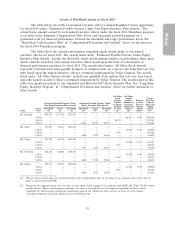
The Committee believes that this weighting puts the appropriate emphasis on maintaining
ROIC at an acceptable level to help ensure that invested capital is providing an appropriate return
over time. In 2014, the threshold and maximum levels of performance criteria for performance share
units were revised from 95% and 110% of target, respectively, for adjusted EBITDA, and 97.51% and
104.98% of target, respectively, for ROIC, to 90% and 120% of target, respectively, for adjusted
EBITDA, and 94.86% and 110.29% of target, respectively, for ROIC, with performance in between
such levels to be determined on the same graduated scale used to determine incentive cash payouts
under our 2014 Teamshare program discussed above between 50% of threshold performance and 300%
for maximum performance. This change reflects the Committee’s desire to align the payout and
performance scale of the short-term and long-term incentive programs. The number of performance
share units earned could vary between 0% and 300% of the target number based on actual
performance compared to target performance on a similar graduated scale as that of our Teamshare
program discussed above. The target performance levels for 2014 adjusted EBITDA and ROIC were
$2.246 billion and 19.44%, respectively. Actual 2014 adjusted EBITDA and adjusted ROIC results were
$2.175 billion (96.84% of adjusted EBITDA target) and 19.50% (100.31% of ROIC target),
respectively. Accordingly, 95.10% of the target number of performance share units was earned as a
result of 2014 performance. The 2014 target adjusted EBITDA and ROIC performance levels,
consistent with prior practice, were the same levels as our 2014 annual financial plan objectives.
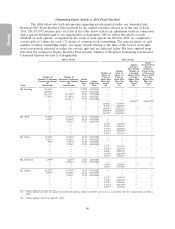
The actual number of performance share units earned for 2014 for each of the named
executive officers was 28,838 for Mr. Dreiling, 6,759 for Mr. Vasos and 4,957 for each of the other
named executive officers. One-third of the performance share units earned based on 2014 financial
performance vested on the last day of the one-year performance period, and the remaining two-thirds
of the performance share units vest equally on the second and third anniversaries of the grant date,
subject to the named executive officer’s continued employment with us and certain accelerated vesting
provisions. All vested performance share units will be settled in shares of our common stock.
The adjusted EBITDA performance target is computed as income (loss) from continuing
operations before cumulative effect of change in accounting principles plus interest and other financing
costs, net, provision for income taxes, and depreciations and amortization, but excludes the impact of
all items excluded from the 2014 Teamshare program adjusted EBIT calculation outlined above, as well
as share-based compensation charges. The ROIC performance target is calculated as (a) the result of
(x) the sum of (i) our operating income, plus (ii) depreciation and amortization, plus (iii) minimum
rentals, minus (y) taxes, divided by (b) the result of (x) the sum of the averages of: (i) total assets, plus
(ii) accumulated depreciation and amortization, minus (y) (i) cash, minus (ii) goodwill, minus
(iii) accounts payable, minus (iv) other payables, minus (v) accrued liabilities, plus (vi) 8x minimum
rentals (with all of the foregoing terms as determined per our financial statements) but excludes the
impact of all items excluded from the 2014 Teamshare program adjusted EBIT calculation outlined
above.
The restricted stock units are payable in shares of our common stock and vest in equal
installments over 3 years from the grant date, subject to continued employment with us and certain
accelerated vesting conditions.
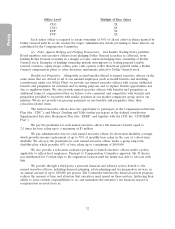
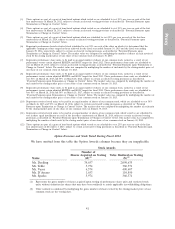
(d) Share Ownership Guidelines and Holding Requirements. We have adopted share ownership
guidelines and holding requirements for senior officers, which are included in our Corporate
Governance Guidelines. The share ownership guideline is a multiple, as set forth below, of the officer’s
annual base salary as in effect on April 1, 2013 (or, if later, the officer’s hire or promotion date) to be
achieved within 5 years of the later of April 1, 2013 or the April 1 next following such person’s hire or
promotion date.
31