Dollar General 2014 Annual Report Download - page 115
Download and view the complete annual report
Please find page 115 of the 2014 Dollar General annual report below. You can navigate through the pages in the report by either clicking on the pages listed below, or by using the keyword search tool below to find specific information within the annual report.-
 1
1 -
2
-
3
-
4
-
5
-
6
-
7
-
8
-
9
-
10
-
11
-
12
-
13
-
14
-
15
-
16
-
17
-
18
-
19
-
20
-
21
-
22
-
23
-
24
-
25
-
26
-
27
-
28
-
29
-
30
-
31
-
32
-
33
-
34
-
35
-
36
-
37
-
38
-
39
-
40
-
41
-
42
-
43
-
44
-
45
-
46
-
47
-
48
-
49
-
50
-
51
-
52
-
53
-
54
-
55
-
56
-
57
-
58
-
59
-
60
-
61
-
62
-
63
-
64
-
65
-
66
-
67
-
68
-
69
-
70
-
71
-
72
-
73
-
74
-
75
-
76
-
77
-
78
-
79
-
80
-
81
-
82
-
83
-
84
-
85
-
86
-
87
-
88
-
89
-
90
-
91
-
92
-
93
-
94
-
95
-
96
-
97
-
98
-
99
-
100
-
101
-
102
-
103
-
104
-
 105
105 -
 106
106 -
 107
107 -
 108
108 -
 109
109 -
 110
110 -
 111
111 -
 112
112 -
 113
113 -
 114
114 -
 115
115 -
 116
116 -
 117
117 -
 118
118 -
 119
119 -
 120
120 -
 121
121 -
 122
122 -
 123
123 -
 124
124 -
 125
125 -
126
-
127
-
128
-
129
-
130
-
131
-
132
-
133
-
134
-
135
-
136
-
137
-
138
-
139
-
140
-
141
-
142
-
143
-
144
-
145
-
146
-
147
-
148
-
149
-
150
-
151
-
152
-
153
-
154
-
155
-
156
-
157
-
158
-
159
-
160
-
161
-
162
-
163
-
164
-
165
-
166
-
167
-
168
-
169
-
170
-
171
-
172
-
173
-
174
-
175
-
176
-
177
-
178
-
179
-
180
 |
 |

10-K
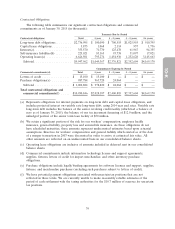
in working capital, including Merchandise inventories, Accounts payable and Accrued expenses and
other. The impact of the changes in inventory balances, which increased in both years but by a lesser
amount in 2013 compared to 2012, is explained in more detail below. Items positively affecting Accrued
expenses and other include the timing of accruals and payments for legal settlements and non-income
taxes (primarily sales taxes), and the adjustment of accruals during 2012 resulting from the favorable
resolution of income tax examinations which did not recur in 2013. Partially offsetting the positive
impact of the items discussed above were reduced incentive compensation accruals, increased cash
payments for income taxes, and changes in Accounts payable, which are affected by the timing and mix
of merchandise purchases, the most significant category of which were domestic purchases.
In addition, our merchandise inventories increased by 7% during 2013, compared to a 19%
increase in 2012. The percentage increase in inventories in 2013 was less than the prior year due to our
emphasis on more effective inventory management and our related efforts to control shrink. Inventory
levels in the consumables category increased by $168.0 million, or 12%, in 2013 compared to an
increase of $245.7 million, or 22%, in 2012. The seasonal category decreased by $4.7 million, or 1%, in
2013 compared to an increase of $70.2 million, or 18%, in 2012. The home products category increased
$22.0 million, or 9%, in 2013 compared to an increase of $56.2 million, or 29%, in 2012. The apparel
category decreased by $29.5 million, or 9%, in 2013 compared to an increase of $16.0 million, or 5%,
in 2012.
Cash flows from investing activities. Significant components of property and equipment purchases
in 2014 included the following approximate amounts: $127 million for improvements, upgrades,
remodels and relocations of existing stores; $102 million for new leased stores; $64 million for
distribution and transportation-related projects; $38 million for stores built by us; and $35 million for
information systems upgrades and technology-related projects. The timing of new, remodeled and
relocated store openings along with other factors may affect the relationship between such openings
and the related property and equipment purchases in any given period. During 2014, we opened 700
new stores and remodeled or relocated 915 stores. See ‘‘—Liquidity and Capital Resources.’’ Cash flows
from investing activities decreased from 2013 to 2014, due primarily to a sale-leaseback transaction in
2013 (more fully described below).
Significant components of property and equipment purchases in 2013 included the following
approximate amounts: $187 million for improvements, upgrades, remodels and relocations of existing
stores; $124 million for new leased stores; $112 million for distribution centers, which included a
significant portion of the construction cost of a distribution center in Pennsylvania; $76 million for
stores purchased or built by us; and $28 million for information systems upgrades and technology-
related projects. During 2013, we opened 650 new stores and remodeled or relocated 582 stores. Our
sale-leaseback transaction which we consummated in January 2014 for 233 of our stores resulted in
proceeds from the sale of these properties of approximately $281.6 million.
Significant components of property and equipment purchases in 2012 included the following
approximate amounts: $155 million for new leased stores; $151 million for improvements, upgrades,
remodels and relocations of existing stores; $132 million for stores purchased or built by us; $83 million
for distribution centers; $27 million for systems-related capital projects; and $17 million for
transportation-related projects. During 2012, we opened 625 new stores and remodeled or relocated
592 stores.
Capital expenditures during 2015 are projected to be in the range of $500-$550 million. We
anticipate funding 2015 capital requirements with existing cash balances, cash flows from operations,
and if necessary, as of January 30, 2015, we also have significant availability under our Revolving
Facility. We plan to continue to invest in store growth and development of approximately 730 new
stores and approximately 875 stores to be remodeled or relocated. Capital expenditures in 2015 are
anticipated to support our store growth as well as our remodel and relocation initiatives, including
41