Dollar General 2014 Annual Report Download - page 107
Download and view the complete annual report
Please find page 107 of the 2014 Dollar General annual report below. You can navigate through the pages in the report by either clicking on the pages listed below, or by using the keyword search tool below to find specific information within the annual report.-
 1
1 -
2
-
3
-
4
-
5
-
6
-
7
-
8
-
9
-
10
-
11
-
12
-
13
-
14
-
15
-
16
-
17
-
18
-
19
-
20
-
21
-
22
-
23
-
24
-
25
-
26
-
27
-
28
-
29
-
30
-
31
-
32
-
33
-
34
-
35
-
36
-
37
-
38
-
39
-
40
-
41
-
42
-
43
-
44
-
45
-
46
-
47
-
48
-
49
-
50
-
51
-
52
-
53
-
54
-
55
-
56
-
57
-
58
-
59
-
60
-
61
-
62
-
63
-
64
-
65
-
66
-
67
-
68
-
69
-
70
-
71
-
72
-
73
-
74
-
75
-
76
-
77
-
78
-
79
-
80
-
81
-
82
-
83
-
84
-
85
-
86
-
87
-
88
-
89
-
90
-
91
-
92
-
93
-
94
-
95
-
96
-
 97
97 -
 98
98 -
 99
99 -
 100
100 -
 101
101 -
 102
102 -
 103
103 -
 104
104 -
 105
105 -
 106
106 -
 107
107 -
 108
108 -
 109
109 -
 110
110 -
 111
111 -
 112
112 -
 113
113 -
 114
114 -
 115
115 -
 116
116 -
 117
117 -
118
-
119
-
120
-
121
-
122
-
123
-
124
-
125
-
126
-
127
-
128
-
129
-
130
-
131
-
132
-
133
-
134
-
135
-
136
-
137
-
138
-
139
-
140
-
141
-
142
-
143
-
144
-
145
-
146
-
147
-
148
-
149
-
150
-
151
-
152
-
153
-
154
-
155
-
156
-
157
-
158
-
159
-
160
-
161
-
162
-
163
-
164
-
165
-
166
-
167
-
168
-
169
-
170
-
171
-
172
-
173
-
174
-
175
-
176
-
177
-
178
-
179
-
180
 |
 |

10-K
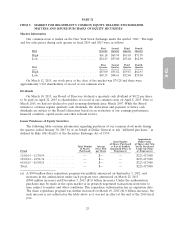
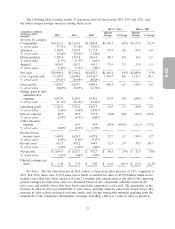
The following table contains results of operations data for fiscal years 2014, 2013 and 2012, and
the dollar and percentage variances among those years.
2014 vs. 2013 2013 vs. 2012
(amounts in millions, Amount Amount
except per share 2014 2013 2012 Change % Change Change % Change
amounts)
Net sales by category:
Consumables ...... $14,321.1 $13,161.8 $11,844.8 $1,159.3 8.8% $1,317.0 11.1%
% of net sales ..... 75.73% 75.19% 73.93%
Seasonal ......... 2,345.0 2,259.5 2,172.4 85.5 3.8 87.1 4.0
% of net sales ..... 12.40% 12.91% 13.56%
Home products .... 1,205.4 1,115.6 1,061.6 89.7 8.0 54.1 5.1
% of net sales ..... 6.37% 6.37% 6.63%
Apparel .......... 1,038.1 967.2 943.3 71.0 7.3 23.9 2.5
% of net sales ..... 5.49% 5.53% 5.89%
Net sales ......... $18,909.6 $17,504.2 $16,022.1 $1,405.4 8.0% $1,482.0 9.2%
Cost of goods sold . . 13,107.1 12,068.4 10,936.7 1,038.7 8.6 1,131.7 10.3
% of net sales ..... 69.31% 68.95% 68.26%
Gross profit ....... 5,802.5 5,435.7 5,085.4 366.8 6.7 350.3 6.9
% of net sales ..... 30.69% 31.05% 31.74%
Selling, general and
administrative
expenses ....... 4,033.4 3,699.6 3,430.1 333.9 9.0 269.4 7.9
% of net sales ..... 21.33% 21.14% 21.41%
Operating profit . . . 1,769.1 1,736.2 1,655.3 32.9 1.9 80.9 4.9
% of net sales ..... 9.36% 9.92% 10.33%
Interest expense .... 88.2 89.0 127.9 (0.8) (0.8) (38.9) (30.4)
% of net sales ..... 0.47% 0.51% 0.80%
Other (income)
expense ........ — 18.9 30.0 (18.9) (100.0) (11.1) (37.0)
% of net sales ..... 0.00% 0.11% 0.19%
Income before
income taxes .... 1,680.9 1,628.3 1,497.4 52.5 3.2 130.9 8.7
% of net sales ..... 8.89% 9.30% 9.35%
Income taxes ...... 615.5 603.2 544.7 12.3 2.0 58.5 10.7
% of net sales ..... 3.26% 3.45% 3.40%
Net income ....... $ 1,065.3 $ 1,025.1 $ 952.7 $ 40.2 3.9% $72.5 7.6%
% of net sales ..... 5.63% 5.86% 5.95%
Diluted earnings per
share .......... $ 3.49 $ 3.17 $ 2.85 $ 0.32 10.1% $0.32 11.2%
Net Sales. The net sales increase in 2014 reflects a same-store sales increase of 2.8% compared to
2013. For 2014, there were 11,052 same-stores which accounted for sales of $17.82 billion. Same-stores
include stores that have been open for at least 13 months and remain open at the end of the reporting
period. Changes in same-store sales are calculated based on the comparable calendar weeks in the
prior year, and include stores that have been remodeled, expanded or relocated. The remainder of the
increase in sales in 2014 was attributable to new stores, partially offset by sales from closed stores. The
increase in sales reflects increased customer traffic and average transaction amounts resulting from the
refinement of the Company’s merchandise offerings, including a full year’s sales of tobacco products,
33