Dollar General 2014 Annual Report Download - page 80
Download and view the complete annual report
Please find page 80 of the 2014 Dollar General annual report below. You can navigate through the pages in the report by either clicking on the pages listed below, or by using the keyword search tool below to find specific information within the annual report.-
 1
1 -
2
-
3
-
4
-
5
-
6
-
7
-
8
-
9
-
10
-
11
-
12
-
13
-
14
-
15
-
16
-
17
-
18
-
19
-
20
-
21
-
22
-
23
-
24
-
25
-
26
-
27
-
28
-
29
-
30
-
31
-
32
-
33
-
34
-
35
-
36
-
37
-
38
-
39
-
40
-
41
-
42
-
43
-
44
-
45
-
46
-
47
-
48
-
49
-
50
-
51
-
52
-
53
-
54
-
55
-
56
-
57
-
58
-
59
-
60
-
61
-
62
-
63
-
64
-
65
-
66
-
67
-
68
-
69
-
 70
70 -
 71
71 -
 72
72 -
 73
73 -
 74
74 -
 75
75 -
 76
76 -
 77
77 -
 78
78 -
 79
79 -
 80
80 -
 81
81 -
 82
82 -
 83
83 -
 84
84 -
 85
85 -
 86
86 -
 87
87 -
 88
88 -
 89
89 -
 90
90 -
91
-
92
-
93
-
94
-
95
-
96
-
97
-
98
-
99
-
100
-
101
-
102
-
103
-
104
-
105
-
106
-
107
-
108
-
109
-
110
-
111
-
112
-
113
-
114
-
115
-
116
-
117
-
118
-
119
-
120
-
121
-
122
-
123
-
124
-
125
-
126
-
127
-
128
-
129
-
130
-
131
-
132
-
133
-
134
-
135
-
136
-
137
-
138
-
139
-
140
-
141
-
142
-
143
-
144
-
145
-
146
-
147
-
148
-
149
-
150
-
151
-
152
-
153
-
154
-
155
-
156
-
157
-
158
-
159
-
160
-
161
-
162
-
163
-
164
-
165
-
166
-
167
-
168
-
169
-
170
-
171
-
172
-
173
-
174
-
175
-
176
-
177
-
178
-
179
-
180
 |
 |

10-K
shopping centers. Most of our customers live within three to five miles, or a 10 minute drive, of our
stores.
Our typical store features a low cost, no frills building with limited maintenance capital, low
operating costs, and a focused merchandise offering within a broad range of categories, allowing us to
deliver low retail prices while generating strong cash flows and investment returns. Our initial capital
investment in new stores and relocations varies depending on the lease structure or ownership as well
as the size and location of the store and the number of coolers appropriate for the location.
We generally have had good success in locating suitable store sites in the past, and we believe that
there is ample opportunity for new store growth in existing and new markets. In addition, we believe
we have significant opportunities available for our relocation and remodel programs.
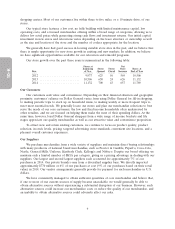
Our store growth over the past three years is summarized in the following table:
Stores at Net
Beginning Stores Stores Store Stores at
Year of Year Opened Closed Increase End of Year
2012 ....................... 9,937 625 56 569 10,506
2013 ....................... 10,506 650 24 626 11,132
2014 ....................... 11,132 700 43 657 11,789
Our Customers
Our customers seek value and convenience. Depending on their financial situation and geographic
proximity, customers’ reliance on Dollar General varies from using Dollar General for fill-in shopping,
to making periodic trips to stock up on household items, to making weekly or more frequent trips to
meet most essential needs. We generally locate our stores and plan our merchandise selections to best
serve the needs of our core customers, the low and fixed income households often underserved by
other retailers, and we are focused on helping them make the most of their spending dollars. At the
same time, however, loyal Dollar General shoppers from a wide range of income brackets and life
stages appreciate our quality merchandise as well as our attractive value and convenience proposition.
To attract new and retain existing customers, we continue to focus on product quality, product
selection, in-stock levels, pricing, targeted advertising, store standards, convenient site locations, and a
pleasant overall customer experience.
Our Suppliers
We purchase merchandise from a wide variety of suppliers and maintain direct buying relationships
with many producers of national brand merchandise, such as Procter & Gamble, PepsiCo, Coca-Cola,
Nestle, General Mills, Unilever, Kimberly Clark, Kellogg’s and Nabisco. Despite our broad offering, we
maintain only a limited number of SKUs per category, giving us a pricing advantage in dealing with our
suppliers. Our largest and second largest suppliers each accounted for approximately 7% of our
purchases in 2014. Our private brands come from a diversified supplier base. We directly imported
approximately $770 million or 6% of our purchases at cost (9% of our purchases based on their retail
value) in 2014. Our vendor arrangements generally provide for payment for such merchandise in U.S.
dollars.
We have consistently managed to obtain sufficient quantities of core merchandise and believe that,
if one or more of our current sources of supply became unavailable, we would generally be able to
obtain alternative sources without experiencing a substantial disruption of our business. However, such
alternative sources could increase our merchandise costs or reduce the quality of our merchandise, and
an inability to obtain alternative sources could adversely affect our sales.
6