Dollar General 2014 Annual Report Download - page 105
Download and view the complete annual report
Please find page 105 of the 2014 Dollar General annual report below. You can navigate through the pages in the report by either clicking on the pages listed below, or by using the keyword search tool below to find specific information within the annual report.-
 1
1 -
2
-
3
-
4
-
5
-
6
-
7
-
8
-
9
-
10
-
11
-
12
-
13
-
14
-
15
-
16
-
17
-
18
-
19
-
20
-
21
-
22
-
23
-
24
-
25
-
26
-
27
-
28
-
29
-
30
-
31
-
32
-
33
-
34
-
35
-
36
-
37
-
38
-
39
-
40
-
41
-
42
-
43
-
44
-
45
-
46
-
47
-
48
-
49
-
50
-
51
-
52
-
53
-
54
-
55
-
56
-
57
-
58
-
59
-
60
-
61
-
62
-
63
-
64
-
65
-
66
-
67
-
68
-
69
-
70
-
71
-
72
-
73
-
74
-
75
-
76
-
77
-
78
-
79
-
80
-
81
-
82
-
83
-
84
-
85
-
86
-
87
-
88
-
89
-
90
-
91
-
92
-
93
-
94
-
 95
95 -
 96
96 -
 97
97 -
 98
98 -
 99
99 -
 100
100 -
 101
101 -
 102
102 -
 103
103 -
 104
104 -
 105
105 -
 106
106 -
 107
107 -
 108
108 -
 109
109 -
 110
110 -
 111
111 -
 112
112 -
 113
113 -
 114
114 -
 115
115 -
116
-
117
-
118
-
119
-
120
-
121
-
122
-
123
-
124
-
125
-
126
-
127
-
128
-
129
-
130
-
131
-
132
-
133
-
134
-
135
-
136
-
137
-
138
-
139
-
140
-
141
-
142
-
143
-
144
-
145
-
146
-
147
-
148
-
149
-
150
-
151
-
152
-
153
-
154
-
155
-
156
-
157
-
158
-
159
-
160
-
161
-
162
-
163
-
164
-
165
-
166
-
167
-
168
-
169
-
170
-
171
-
172
-
173
-
174
-
175
-
176
-
177
-
178
-
179
-
180
 |
 |

10-K
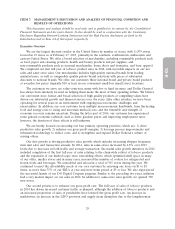
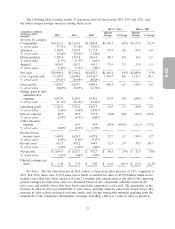
• Our gross profit rate declined by 36 basis points due primarily to an increase in promotional
markdowns, and in addition, sales of lower margin items increased at a proportionally higher
rate than sales of higher margin items.
• The increase in SG&A, as a percentage of sales, was due primarily to a significant increase in
incentive compensation expense as well as an increase in rent expense; partially offset by
efficiencies relating to store labor costs. For other factors, see the detailed discussion that
follows.
• Interest expense was relatively constant, decreasing by $0.8 million in 2014 to $88.2 million. Total
long-term obligations as of January 30, 2015 were $2.74 billion.
• We reported net income of $1.07 billion, or $3.49 per diluted share, for 2014, compared to net
income of $1.03 billion, or $3.17 per diluted share, for 2013. Stock repurchase activity during
2013 and 2014 contributed to the increase in diluted earnings per share.
• We generated approximately $1.31 billion of cash flows from operating activities in 2015, an
increase of 8.4% compared to 2013. We primarily utilized our cash flows from operating
activities to invest in the growth of our business and repurchase our common stock.
• Inventory turnover was 4.8 times on a rolling four-quarter basis. Inventories increased 2.9% on a
per store basis over 2013.
• During 2014 we opened 700 new stores, remodeled or relocated 915 stores, and closed 43 stores.
Also in 2014, we repurchased approximately 14.1 million shares of our outstanding common stock
for $800.1 million.
In 2015, we plan to continue to focus on our four key operating priorities. We expect our sales
growth in 2015 to again be driven by consumables as we expect our customer to continue to face
economic challenges, although we are optimistic recent economic tailwinds may encourage our
customer to purchase more non-consumable items. We plan to focus our efforts on effectively serving
our core customers’ needs by providing them with the selection they want at the right price points in
2015.
We made progress in 2014 on implementing an improved supply chain solution to assist in
promotional and core inventory forecasting and ordering. We expect to make further progress in 2015,
and we expect that eventually all of our SKUs will be managed through this solution. The supply chain
solution is helping us improve our ordering processes in the stores and has contributed to our work
simplification efforts and improvements in maintaining efficient inventory levels. We believe we have
additional opportunities for work simplification and optimization of store labor in 2015.
We are pleased with the performance of our 2014 new stores, remodels and relocations, and in
2015 we plan to open 730 new stores and to remodel or relocate 875 stores.
Finally, we plan to continue to repurchase shares of our common stock in 2015 as well as initiate
quarterly cash dividends, subject to Board discretion, to further enhance shareholder return.
Key Financial Metrics. We have identified the following as our most critical financial metrics:
• Same-store sales growth;
• Sales per square foot;
• Gross profit, as a percentage of sales;
• Selling, general and administrative expenses, as a percentage of sales;
• Operating profit;
31