Dollar General 2014 Annual Report Download - page 124
Download and view the complete annual report
Please find page 124 of the 2014 Dollar General annual report below. You can navigate through the pages in the report by either clicking on the pages listed below, or by using the keyword search tool below to find specific information within the annual report.-
 1
1 -
2
-
3
-
4
-
5
-
6
-
7
-
8
-
9
-
10
-
11
-
12
-
13
-
14
-
15
-
16
-
17
-
18
-
19
-
20
-
21
-
22
-
23
-
24
-
25
-
26
-
27
-
28
-
29
-
30
-
31
-
32
-
33
-
34
-
35
-
36
-
37
-
38
-
39
-
40
-
41
-
42
-
43
-
44
-
45
-
46
-
47
-
48
-
49
-
50
-
51
-
52
-
53
-
54
-
55
-
56
-
57
-
58
-
59
-
60
-
61
-
62
-
63
-
64
-
65
-
66
-
67
-
68
-
69
-
70
-
71
-
72
-
73
-
74
-
75
-
76
-
77
-
78
-
79
-
80
-
81
-
82
-
83
-
84
-
85
-
86
-
87
-
88
-
89
-
90
-
91
-
92
-
93
-
94
-
95
-
96
-
97
-
98
-
99
-
100
-
101
-
102
-
103
-
104
-
105
-
106
-
107
-
108
-
109
-
110
-
111
-
112
-
113
-
 114
114 -
 115
115 -
 116
116 -
 117
117 -
 118
118 -
 119
119 -
 120
120 -
 121
121 -
 122
122 -
 123
123 -
 124
124 -
 125
125 -
 126
126 -
 127
127 -
 128
128 -
 129
129 -
 130
130 -
 131
131 -
 132
132 -
 133
133 -
 134
134 -
135
-
136
-
137
-
138
-
139
-
140
-
141
-
142
-
143
-
144
-
145
-
146
-
147
-
148
-
149
-
150
-
151
-
152
-
153
-
154
-
155
-
156
-
157
-
158
-
159
-
160
-
161
-
162
-
163
-
164
-
165
-
166
-
167
-
168
-
169
-
170
-
171
-
172
-
173
-
174
-
175
-
176
-
177
-
178
-
179
-
180
 |
 |

10-K
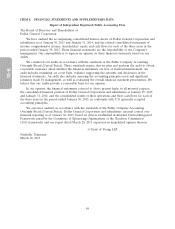
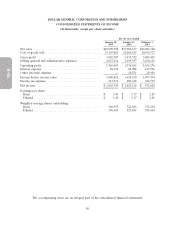
DOLLAR GENERAL CORPORATION AND SUBSIDIARIES
CONSOLIDATED STATEMENTS OF INCOME
(In thousands, except per share amounts)
For the Year Ended
January 30, January 31, February 1,
2015 2014 2013
Net sales ...................................... $18,909,588 $17,504,167 $16,022,128
Cost of goods sold ............................... 13,107,081 12,068,425 10,936,727
Gross profit .................................... 5,802,507 5,435,742 5,085,401
Selling, general and administrative expenses ............. 4,033,414 3,699,557 3,430,125
Operating profit ................................. 1,769,093 1,736,185 1,655,276
Interest expense ................................. 88,232 88,984 127,926
Other (income) expense ........................... — 18,871 29,956
Income before income taxes ........................ 1,680,861 1,628,330 1,497,394
Income tax expense .............................. 615,516 603,214 544,732
Net income .................................... $ 1,065,345 $ 1,025,116 $ 952,662
Earnings per share:
Basic ....................................... $ 3.50 $ 3.17 $ 2.87
Diluted ...................................... $ 3.49 $ 3.17 $ 2.85
Weighted average shares outstanding:
Basic ....................................... 304,633 322,886 332,254
Diluted ...................................... 305,681 323,854 334,469
The accompanying notes are an integral part of the consolidated financial statements.
50