Dollar General 2014 Annual Report Download - page 108
Download and view the complete annual report
Please find page 108 of the 2014 Dollar General annual report below. You can navigate through the pages in the report by either clicking on the pages listed below, or by using the keyword search tool below to find specific information within the annual report.-
 1
1 -
2
-
3
-
4
-
5
-
6
-
7
-
8
-
9
-
10
-
11
-
12
-
13
-
14
-
15
-
16
-
17
-
18
-
19
-
20
-
21
-
22
-
23
-
24
-
25
-
26
-
27
-
28
-
29
-
30
-
31
-
32
-
33
-
34
-
35
-
36
-
37
-
38
-
39
-
40
-
41
-
42
-
43
-
44
-
45
-
46
-
47
-
48
-
49
-
50
-
51
-
52
-
53
-
54
-
55
-
56
-
57
-
58
-
59
-
60
-
61
-
62
-
63
-
64
-
65
-
66
-
67
-
68
-
69
-
70
-
71
-
72
-
73
-
74
-
75
-
76
-
77
-
78
-
79
-
80
-
81
-
82
-
83
-
84
-
85
-
86
-
87
-
88
-
89
-
90
-
91
-
92
-
93
-
94
-
95
-
96
-
97
-
 98
98 -
 99
99 -
 100
100 -
 101
101 -
 102
102 -
 103
103 -
 104
104 -
 105
105 -
 106
106 -
 107
107 -
 108
108 -
 109
109 -
 110
110 -
 111
111 -
 112
112 -
 113
113 -
 114
114 -
 115
115 -
 116
116 -
 117
117 -
 118
118 -
119
-
120
-
121
-
122
-
123
-
124
-
125
-
126
-
127
-
128
-
129
-
130
-
131
-
132
-
133
-
134
-
135
-
136
-
137
-
138
-
139
-
140
-
141
-
142
-
143
-
144
-
145
-
146
-
147
-
148
-
149
-
150
-
151
-
152
-
153
-
154
-
155
-
156
-
157
-
158
-
159
-
160
-
161
-
162
-
163
-
164
-
165
-
166
-
167
-
168
-
169
-
170
-
171
-
172
-
173
-
174
-
175
-
176
-
177
-
178
-
179
-
180
 |
 |

10-K
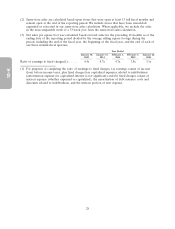
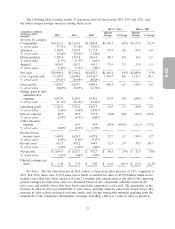
the expansion of perishables, and enhanced utilization of store square footage. Increases in sales of
consumables outpaced our non-consumables, with sales of tobacco products, perishables, and candy and
snacks contributing the majority of the increase in sales of consumables.
The net sales increase in 2013 reflects a same-store sales increase of 3.3% compared to 2012. For
2013, there were 10,387 same-stores which accounted for sales of $16.37 billion. The remainder of the
increase in sales in 2013 was attributable to new stores, partially offset by sales from closed stores. The
increase in sales reflects increased customer traffic and average transaction amounts. Increases in sales
of consumables outpaced our non-consumables, with sales of tobacco products, perishables, and candy
and snacks contributing the majority of the increase. Tobacco was added in the stores primarily during
the first and second quarters of 2013. The expansion of coolers for perishables in over 1,600 existing
stores was completed in the first half of the year while other initiatives, including space optimization in
many of our smaller stores, were implemented throughout the year.
Of our four major merchandise categories, the consumables category, which generally has a lower
gross profit rate than the other three categories, has grown most significantly over the past several
years. Because of the impact of sales mix on gross profit, we continually review our merchandise mix
and strive to adjust it when appropriate.
Gross Profit. The gross profit rate as a percentage of sales was 30.7% in 2014 compared to 31.1%
in 2013. Gross profit increased by 6.7% in 2014, and as a percentage of sales, decreased by 36 basis
points. The most significant factor affecting the gross profit rate was an increase in markdowns,
primarily due to increased promotions driven by competitive pressures. In addition, we are experiencing
an ongoing trend of consumables comprising a larger portion of our net sales, primarily as the result of
increased sales of lower margin consumables including tobacco products and expanded perishables
offerings. These factors were partially offset by higher initial inventory markups. We recorded a LIFO
provision of $4.2 million in 2014 compared to a LIFO benefit of $11.0 million in 2013.
The gross profit rate as a percentage of sales was 31.1% in 2013 compared to 31.7% in 2012.
Gross profit increased by 6.9% in 2013, and as a percentage of sales, decreased by 69 basis points. The
majority of the gross profit rate decrease in 2013 as compared to 2012 was due to consumables
comprising a larger portion of our net sales, primarily as the result of increased sales of lower margin
consumables which contributed to lower initial inventory markups. In addition, we experienced a higher
inventory shrinkage rate, partially attributable to the addition of certain consumable products with
relatively higher retail prices. These factors were partially offset by a reduction in net purchase costs on
certain products. The Company recorded a LIFO benefit of $11.0 million in 2013 compared to a LIFO
provision of $1.4 million in 2012.
SG&A Expense. SG&A expense was 21.3% as a percentage of sales in 2014 compared to 21.1%
in 2013, an increase of 19 basis points. The results reflect a significant increase in incentive
compensation expense, as our prior year 2013 financial performance did not satisfy certain performance
requirements under our cash incentive compensation program. The 2014 results also reflect increases in
rent and utilities. Partially offsetting these increased costs were retail labor expense, which increased at
a rate lower than our increase in sales, the introduction of convenience fees charged to customers for
cash back on debit card transactions, and a reduction in workers’ compensation and general liability
expenses. The 2014 period included expenses of $14.3 million relating to an attempted acquisition,
while the 2013 results include expenses of $8.5 million for a legal settlement of a previously decertified
collective action.
SG&A expense was 21.1% as a percentage of sales in 2013 compared to 21.4% in 2012, an
improvement of 27 basis points. We had a significant decrease in incentive compensation expense, as
2013 financial performance did not satisfy certain performance requirements under our cash incentive
compensation program. Retail labor expense increased at a rate lower than our increase in sales.
Declines in workers’ compensation and general liability expenses also contributed to the overall
34