Dollar General 2014 Annual Report Download - page 114
Download and view the complete annual report
Please find page 114 of the 2014 Dollar General annual report below. You can navigate through the pages in the report by either clicking on the pages listed below, or by using the keyword search tool below to find specific information within the annual report.-
 1
1 -
2
-
3
-
4
-
5
-
6
-
7
-
8
-
9
-
10
-
11
-
12
-
13
-
14
-
15
-
16
-
17
-
18
-
19
-
20
-
21
-
22
-
23
-
24
-
25
-
26
-
27
-
28
-
29
-
30
-
31
-
32
-
33
-
34
-
35
-
36
-
37
-
38
-
39
-
40
-
41
-
42
-
43
-
44
-
45
-
46
-
47
-
48
-
49
-
50
-
51
-
52
-
53
-
54
-
55
-
56
-
57
-
58
-
59
-
60
-
61
-
62
-
63
-
64
-
65
-
66
-
67
-
68
-
69
-
70
-
71
-
72
-
73
-
74
-
75
-
76
-
77
-
78
-
79
-
80
-
81
-
82
-
83
-
84
-
85
-
86
-
87
-
88
-
89
-
90
-
91
-
92
-
93
-
94
-
95
-
96
-
97
-
98
-
99
-
100
-
101
-
102
-
103
-
 104
104 -
 105
105 -
 106
106 -
 107
107 -
 108
108 -
 109
109 -
 110
110 -
 111
111 -
 112
112 -
 113
113 -
 114
114 -
 115
115 -
 116
116 -
 117
117 -
 118
118 -
 119
119 -
 120
120 -
 121
121 -
 122
122 -
 123
123 -
 124
124 -
125
-
126
-
127
-
128
-
129
-
130
-
131
-
132
-
133
-
134
-
135
-
136
-
137
-
138
-
139
-
140
-
141
-
142
-
143
-
144
-
145
-
146
-
147
-
148
-
149
-
150
-
151
-
152
-
153
-
154
-
155
-
156
-
157
-
158
-
159
-
160
-
161
-
162
-
163
-
164
-
165
-
166
-
167
-
168
-
169
-
170
-
171
-
172
-
173
-
174
-
175
-
176
-
177
-
178
-
179
-
180
 |
 |

10-K
Share Repurchase Program
On March 10, 2015, the Company’s Board of Directors authorized a $1.0 billion increase to our
existing common stock repurchase program. The total remaining authorization is approximately
$1.2 billion at March 12, 2015. Under the authorization, purchases may be made in the open market or
in privately negotiated transactions from time to time subject to market and other conditions, and the
authorization has no expiration date. For more detail about our share repurchase program, see Note 12
to the consolidated financial statements.
Other Considerations
On March 10, 2015, the Board of Directors approved a quarterly cash dividend to shareholders of
$0.22 per share which will be paid on April 22, 2015 to shareholders of record on April 8, 2015.
Although the Board currently intends to continue regular quarterly cash dividends, the payment of
future cash dividends are subject to the Board’s discretion and will depend upon, among other things,
our results of operations, cash requirements, financial condition, contractual restrictions and other
factors that our Board may deem relevant.
Our inventory balance represented approximately 49% of our total assets exclusive of goodwill and
other intangible assets as of January 30, 2015. Our ability to effectively manage our inventory balances
can have a significant impact on our cash flows from operations during a given fiscal year. Inventory
purchases are often somewhat seasonal in nature, such as the purchase of warm-weather or Christmas-
related merchandise. Efficient management of our inventory has been and continues to be an area of
focus for us.
As described in Note 8 to the consolidated financial statements, we are involved in a number of
legal actions and claims, some of which could potentially result in material cash payments. Adverse
developments in those actions could materially and adversely affect our liquidity. We also have certain
income tax-related contingencies as disclosed in Note 4 to the consolidated financial statements. Future
negative developments could have a material adverse effect on our liquidity.
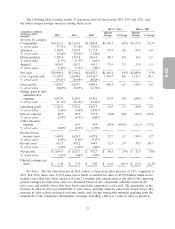
Cash Flows
Cash flows from operating activities. Cash flows from operating activities were $1.31 billion in
2014, an increase of $101.7 million compared to 2013. Significant components of the increase in cash
flows from operating activities in 2014 compared to 2013 include increased net income due primarily to
increased sales and operating profit in 2014 as described in more detail above under ‘‘Results of
Operations.’’ Merchandise inventories increased by a greater amount in 2014 compared to 2013, which
was partially offset by accounts payable, which increased by $97.2 million in 2014 compared to a
$36.9 million increase in 2013. The increase in accounts payable during 2014 was due primarily to the
volume and timing of domestic merchandise receipts. On an ongoing basis, we closely monitor and
manage our inventory balances, and they may fluctuate from period to period based on new store
openings, the timing of purchases, and other factors. Merchandise inventories increased by 9% during
2014, compared to a 7% increase in 2013. Inventory levels in the consumables category increased by
$178.4 million, or 12%, in 2014 compared to an increase of $168.0 million, or 12%, in 2013. The
seasonal category increased by $13.8 million, or 3%, in 2014 compared to a decrease of $4.7 million, or
1%, in 2013. The home products category was essentially unchanged in 2014 compared to an increase
of $22.0 million, or 9%, in 2013. The apparel category increased by $37.1 million, or 13%, in 2014
compared to a decrease of $29.5 million, or 9%, in 2013.
Significant components of the increase in cash flows from operating activities in 2013 compared to
2012 include increased net income due primarily to increased sales and lower SG&A expenses, as a
percentage of sales, in 2013 as described in more detail above under ‘‘Results of Operations.’’
Significant components of the increase in cash flows from operating activities were related to changes
40