Dollar General 2014 Annual Report Download - page 159
Download and view the complete annual report
Please find page 159 of the 2014 Dollar General annual report below. You can navigate through the pages in the report by either clicking on the pages listed below, or by using the keyword search tool below to find specific information within the annual report.-
 1
1 -
2
-
3
-
4
-
5
-
6
-
7
-
8
-
9
-
10
-
11
-
12
-
13
-
14
-
15
-
16
-
17
-
18
-
19
-
20
-
21
-
22
-
23
-
24
-
25
-
26
-
27
-
28
-
29
-
30
-
31
-
32
-
33
-
34
-
35
-
36
-
37
-
38
-
39
-
40
-
41
-
42
-
43
-
44
-
45
-
46
-
47
-
48
-
49
-
50
-
51
-
52
-
53
-
54
-
55
-
56
-
57
-
58
-
59
-
60
-
61
-
62
-
63
-
64
-
65
-
66
-
67
-
68
-
69
-
70
-
71
-
72
-
73
-
74
-
75
-
76
-
77
-
78
-
79
-
80
-
81
-
82
-
83
-
84
-
85
-
86
-
87
-
88
-
89
-
90
-
91
-
92
-
93
-
94
-
95
-
96
-
97
-
98
-
99
-
100
-
101
-
102
-
103
-
104
-
105
-
106
-
107
-
108
-
109
-
110
-
111
-
112
-
113
-
114
-
115
-
116
-
117
-
118
-
119
-
120
-
121
-
122
-
123
-
124
-
125
-
126
-
127
-
128
-
129
-
130
-
131
-
132
-
133
-
134
-
135
-
136
-
137
-
138
-
139
-
140
-
141
-
142
-
143
-
144
-
145
-
146
-
147
-
148
-
 149
149 -
 150
150 -
 151
151 -
 152
152 -
 153
153 -
 154
154 -
 155
155 -
 156
156 -
 157
157 -
 158
158 -
 159
159 -
 160
160 -
 161
161 -
 162
162 -
 163
163 -
 164
164 -
 165
165 -
 166
166 -
 167
167 -
 168
168 -
 169
169 -
170
-
171
-
172
-
173
-
174
-
175
-
176
-
177
-
178
-
179
-
180
 |
 |

10-K
DOLLAR GENERAL CORPORATION AND SUBSIDIARIES
NOTES TO CONSOLIDATED FINANCIAL STATEMENTS (Continued)
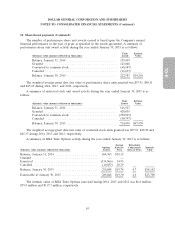
10. Share-based payments (Continued)
The number of performance share unit awards earned is based upon the Company’s annual
financial performance in the year of grant as specified in the award agreement. A summary of
performance share unit award activity during the year ended January 30, 2015 is as follows:
Units Intrinsic
(Intrinsic value amounts reflected in thousands) Issued Value
Balance, January 31, 2014 ............................. 159,419
Granted .......................................... 143,048
Converted to common stock ........................... (68,187)
Canceled ......................................... (21,697)
Balance, January 30, 2015 ............................. 212,583 $14,256
The weighted average grant date fair value of performance share units granted was $57.91, $48.11
and $45.25 during 2014, 2013, and 2012, respectively.
A summary of restricted stock unit award activity during the year ended January 30, 2015 is as
follows:
Units Intrinsic
(Intrinsic value amounts reflected in thousands) Issued Value
Balance, January 31, 2014 ............................ 616,527
Granted ......................................... 420,035
Converted to common stock .......................... (230,907)
Canceled ........................................ (90,797)
Balance, January 30, 2015 ............................ 714,858 $47,938
The weighted average grant date fair value of restricted stock units granted was $57.87, $48.20 and
$45.33 during 2014, 2013 and 2012, respectively.
A summary of MSA Time Options activity during the year ended January 30, 2015 is as follows:
Average Remaining
Options Exercise Contractual Intrinsic
(Intrinsic value amounts reflected in thousands) Issued Price Term in Years Value
Balance, January 31, 2014 ........................ 464,563 $18.15
Granted ..................................... — —
Exercised .................................... (154,866) 14.95
Canceled ..................................... (10,853) 20.39
Balance, January 30, 2015 ........................ 298,844 $19.74 4.7 $14,142
Exercisable at January 30, 2015 .................... 286,848 $19.30 4.6 $13,700
The intrinsic value of MSA Time Options exercised during 2014, 2013 and 2012 was $6.8 million,
$39.4 million and $117.3 million, respectively.
85