Dollar General 2014 Annual Report Download - page 138
Download and view the complete annual report
Please find page 138 of the 2014 Dollar General annual report below. You can navigate through the pages in the report by either clicking on the pages listed below, or by using the keyword search tool below to find specific information within the annual report.-
 1
1 -
2
-
3
-
4
-
5
-
6
-
7
-
8
-
9
-
10
-
11
-
12
-
13
-
14
-
15
-
16
-
17
-
18
-
19
-
20
-
21
-
22
-
23
-
24
-
25
-
26
-
27
-
28
-
29
-
30
-
31
-
32
-
33
-
34
-
35
-
36
-
37
-
38
-
39
-
40
-
41
-
42
-
43
-
44
-
45
-
46
-
47
-
48
-
49
-
50
-
51
-
52
-
53
-
54
-
55
-
56
-
57
-
58
-
59
-
60
-
61
-
62
-
63
-
64
-
65
-
66
-
67
-
68
-
69
-
70
-
71
-
72
-
73
-
74
-
75
-
76
-
77
-
78
-
79
-
80
-
81
-
82
-
83
-
84
-
85
-
86
-
87
-
88
-
89
-
90
-
91
-
92
-
93
-
94
-
95
-
96
-
97
-
98
-
99
-
100
-
101
-
102
-
103
-
104
-
105
-
106
-
107
-
108
-
109
-
110
-
111
-
112
-
113
-
114
-
115
-
116
-
117
-
118
-
119
-
120
-
121
-
122
-
123
-
124
-
125
-
126
-
127
-
 128
128 -
 129
129 -
 130
130 -
 131
131 -
 132
132 -
 133
133 -
 134
134 -
 135
135 -
 136
136 -
 137
137 -
 138
138 -
 139
139 -
 140
140 -
 141
141 -
 142
142 -
 143
143 -
 144
144 -
 145
145 -
 146
146 -
 147
147 -
 148
148 -
149
-
150
-
151
-
152
-
153
-
154
-
155
-
156
-
157
-
158
-
159
-
160
-
161
-
162
-
163
-
164
-
165
-
166
-
167
-
168
-
169
-
170
-
171
-
172
-
173
-
174
-
175
-
176
-
177
-
178
-
179
-
180
 |
 |

10-K
DOLLAR GENERAL CORPORATION AND SUBSIDIARIES
NOTES TO CONSOLIDATED FINANCIAL STATEMENTS (Continued)
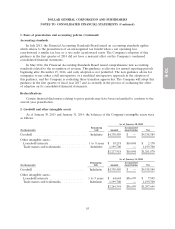
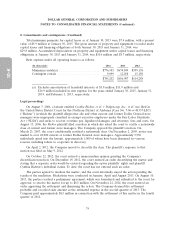
2. Goodwill and other intangible assets (Continued)
The Company recorded amortization expense related to amortizable intangible assets for 2014,
2013 and 2012 of $5.8 million, $11.9 million and $16.9 million, respectively, all of which is included in
rent expense. Expected future cash flows associated with the Company’s intangible assets are not
expected to be materially affected by the Company’s intent or ability to renew or extend the
arrangements. The Company’s goodwill balance is not expected to be deductible for tax purposes.
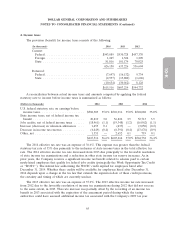
For intangible assets subject to amortization, the estimated aggregate amortization expense for
each of the five succeeding fiscal years is as follows: 2015—$0.9 million, 2016—$0.3 million, 2017—
$0.2 million, 2018—$0.2 million and 2019—$0.2 million.
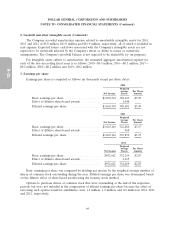
3. Earnings per share
Earnings per share is computed as follows (in thousands except per share data):
2014
Weighted
Average Per Share
Net Income Shares Amount
Basic earnings per share .................... $1,065,345 304,633 $3.50
Effect of dilutive share-based awards ........... 1,048
Diluted earnings per share .................. $1,065,345 305,681 $3.49
2013
Weighted
Average Per Share
Net Income Shares Amount
Basic earnings per share .................... $1,025,116 322,886 $3.17
Effect of dilutive share-based awards ........... 968
Diluted earnings per share .................. $1,025,116 323,854 $3.17
2012
Weighted
Average Per Share
Net Income Shares Amount
Basic earnings per share ..................... $952,662 332,254 $2.87
Effect of dilutive share-based awards ............ 2,215
Diluted earnings per share ................... $952,662 334,469 $2.85
Basic earnings per share was computed by dividing net income by the weighted average number of
shares of common stock outstanding during the year. Diluted earnings per share was determined based
on the dilutive effect of share-based awards using the treasury stock method.
Options to purchase shares of common stock that were outstanding at the end of the respective
periods, but were not included in the computation of diluted earnings per share because the effect of
exercising such options would be antidilutive, were 1.2 million, 1.2 million, and 0.8 million in 2014, 2013
and 2012, respectively.
64