Dollar General 2014 Annual Report Download - page 116
Download and view the complete annual report
Please find page 116 of the 2014 Dollar General annual report below. You can navigate through the pages in the report by either clicking on the pages listed below, or by using the keyword search tool below to find specific information within the annual report.-
 1
1 -
2
-
3
-
4
-
5
-
6
-
7
-
8
-
9
-
10
-
11
-
12
-
13
-
14
-
15
-
16
-
17
-
18
-
19
-
20
-
21
-
22
-
23
-
24
-
25
-
26
-
27
-
28
-
29
-
30
-
31
-
32
-
33
-
34
-
35
-
36
-
37
-
38
-
39
-
40
-
41
-
42
-
43
-
44
-
45
-
46
-
47
-
48
-
49
-
50
-
51
-
52
-
53
-
54
-
55
-
56
-
57
-
58
-
59
-
60
-
61
-
62
-
63
-
64
-
65
-
66
-
67
-
68
-
69
-
70
-
71
-
72
-
73
-
74
-
75
-
76
-
77
-
78
-
79
-
80
-
81
-
82
-
83
-
84
-
85
-
86
-
87
-
88
-
89
-
90
-
91
-
92
-
93
-
94
-
95
-
96
-
97
-
98
-
99
-
100
-
101
-
102
-
103
-
104
-
105
-
 106
106 -
 107
107 -
 108
108 -
 109
109 -
 110
110 -
 111
111 -
 112
112 -
 113
113 -
 114
114 -
 115
115 -
 116
116 -
 117
117 -
 118
118 -
 119
119 -
 120
120 -
 121
121 -
 122
122 -
 123
123 -
 124
124 -
 125
125 -
 126
126 -
127
-
128
-
129
-
130
-
131
-
132
-
133
-
134
-
135
-
136
-
137
-
138
-
139
-
140
-
141
-
142
-
143
-
144
-
145
-
146
-
147
-
148
-
149
-
150
-
151
-
152
-
153
-
154
-
155
-
156
-
157
-
158
-
159
-
160
-
161
-
162
-
163
-
164
-
165
-
166
-
167
-
168
-
169
-
170
-
171
-
172
-
173
-
174
-
175
-
176
-
177
-
178
-
179
-
180
 |
 |

10-K
capital outlays for leasehold improvements, fixtures and equipment; the construction of new stores;
costs to support and enhance our supply chain initiatives including the distribution center under
construction in Texas; technology initiatives; as well as routine and ongoing capital requirements.
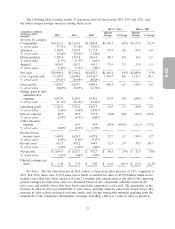
Cash flows from financing activities. In 2014, we repurchased 14.1 million outstanding shares of
our common stock at a total cost of $800.1 million. We made repayments of $75.0 million on the
balance of the Term Facility. Borrowings and repayments under the Revolving Facility during the 2014
period were the same amount, resulting in no net increase to amounts outstanding under the Revolving
Facility during 2014.
The 2013 cash flows from financing activities reflect our refinancing in April 2013, including the
issuance of long-term obligations which includes the $1.0 billion unsecured Term Facility and the
issuance of Senior Notes totaling approximately $1.3 billion. Proceeds from these transactions were
used to extinguish our previous secured term loan and revolving credit facilities which had balances of
$1.96 billion and $155.6 million at termination. Net repayments under the Revolving Facility were
$130.9 million during 2013. We paid debt issuance costs and hedging fees totaling $29.2 million in 2013
related to the refinancing. Also in 2013, we repurchased 11.0 million outstanding shares of our common
stock at a total cost of $620.1 million.
In 2012 we repurchased 14.4 million outstanding shares of our common stock at a total cost of
$671.4 million. In July 2012, we issued $500.0 million aggregate principal amount of 4.125% senior
notes due 2017. Also in July 2012, we redeemed the remaining aggregate principal amount of senior
subordinated notes due 2017 at a redemption price of 105.938% of the principal amount thereof,
resulting in a cash outflow of $477.5 million. Net borrowings under our senior secured revolving credit
facility were $101.8 million during 2012.
Critical Accounting Policies and Estimates
The preparation of financial statements in accordance with U.S. GAAP requires management to
make estimates and assumptions that affect reported amounts and related disclosures. In addition to
the estimates presented below, there are other items within our financial statements that require
estimation, but are not deemed critical as defined below. We believe these estimates are reasonable and
appropriate. However, if actual experience differs from the assumptions and other considerations used,
the resulting changes could have a material effect on the financial statements taken as a whole.
Management believes the following policies and estimates are critical because they involve
significant judgments, assumptions, and estimates. Management has discussed the development and
selection of the critical accounting estimates with the Audit Committee of our Board of Directors, and
the Audit Committee has reviewed the disclosures presented below relating to those policies and
estimates. See Note 1 to the consolidated financial statements for a detailed discussion of our principal
accounting policies.
Merchandise Inventories. Merchandise inventories are stated at the lower of cost or market
(‘‘LCM’’) with cost determined using the retail last in, first out (‘‘LIFO’’) method. We use the retail
inventory method (‘‘RIM’’) to calculate gross profit and the resulting valuation of inventories at cost,
which are computed by applying a calculated cost-to-retail inventory ratio to the retail value of sales at
a department level. The RIM is an averaging method that has been widely used in the retail industry
due to its practicality. Also, the use of the RIM will result in valuing inventories at LCM if markdowns
are currently taken as a reduction of the retail value of inventories. Inherent in the retail inventory
method calculation are certain significant management judgments and estimates including, among
others, initial markups, markdowns, and shrinkage, which significantly impact the gross profit
calculation as well as the ending inventory valuation at cost. These significant estimates, coupled with
42