Dollar General 2014 Annual Report Download - page 51
Download and view the complete annual report
Please find page 51 of the 2014 Dollar General annual report below. You can navigate through the pages in the report by either clicking on the pages listed below, or by using the keyword search tool below to find specific information within the annual report.-
 1
1 -
2
-
3
-
4
-
5
-
6
-
7
-
8
-
9
-
10
-
11
-
12
-
13
-
14
-
15
-
16
-
17
-
18
-
19
-
20
-
21
-
22
-
23
-
24
-
25
-
26
-
27
-
28
-
29
-
30
-
31
-
32
-
33
-
34
-
35
-
36
-
37
-
38
-
39
-
40
-
 41
41 -
 42
42 -
 43
43 -
 44
44 -
 45
45 -
 46
46 -
 47
47 -
 48
48 -
 49
49 -
 50
50 -
 51
51 -
 52
52 -
 53
53 -
 54
54 -
 55
55 -
 56
56 -
 57
57 -
 58
58 -
 59
59 -
 60
60 -
 61
61 -
62
-
63
-
64
-
65
-
66
-
67
-
68
-
69
-
70
-
71
-
72
-
73
-
74
-
75
-
76
-
77
-
78
-
79
-
80
-
81
-
82
-
83
-
84
-
85
-
86
-
87
-
88
-
89
-
90
-
91
-
92
-
93
-
94
-
95
-
96
-
97
-
98
-
99
-
100
-
101
-
102
-
103
-
104
-
105
-
106
-
107
-
108
-
109
-
110
-
111
-
112
-
113
-
114
-
115
-
116
-
117
-
118
-
119
-
120
-
121
-
122
-
123
-
124
-
125
-
126
-
127
-
128
-
129
-
130
-
131
-
132
-
133
-
134
-
135
-
136
-
137
-
138
-
139
-
140
-
141
-
142
-
143
-
144
-
145
-
146
-
147
-
148
-
149
-
150
-
151
-
152
-
153
-
154
-
155
-
156
-
157
-
158
-
159
-
160
-
161
-
162
-
163
-
164
-
165
-
166
-
167
-
168
-
169
-
170
-
171
-
172
-
173
-
174
-
175
-
176
-
177
-
178
-
179
-
180
 |
 |

Proxy
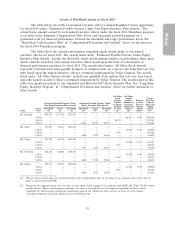
Grants of Plan-Based Awards in Fiscal 2014
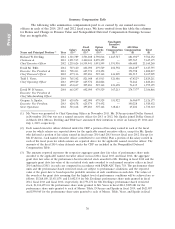
The table below sets forth each named executive officer’s annual Teamshare bonus opportunity
for fiscal 2014 under ‘‘Estimated Possible Payouts Under Non-Equity Incentive Plan Awards.’’ The
actual bonus amount earned by each named executive officer under the fiscal 2014 Teamshare program
is set forth in the Summary Compensation Table above and represents prorated payment on a
graduated scale for financial performance between the threshold and target performance levels. See
‘‘Short-Term Cash Incentive Plan’’ in ‘‘Compensation Discussion and Analysis’’ above for discussion of
the fiscal 2014 Teamshare program.
The table below also includes information regarding equity awards made to our named
executive officers for fiscal 2014. The awards listed under ‘‘Estimated Possible Payouts Under Equity
Incentive Plan Awards’’ include the threshold, target and maximum number of performance share units
which could be earned by each named executive officer based upon the level of achievement of
financial performance measures for fiscal 2014. The awards listed under ‘‘All Other Stock Awards’’
represent restricted stock units payable in shares of common stock on a one-for-one basis that vest over
time based upon the named executive officer’s continued employment by Dollar General. The awards
listed under ‘‘All Other Option Awards’’ include non-qualified stock options that vest over time based
upon the named executive officer’s continued employment by Dollar General. The awards listed in this
table were granted pursuant to our Amended and Restated 2007 Stock Incentive Plan. See ‘‘Long-Term
Equity Incentive Program’’ in ‘‘Compensation Discussion and Analysis’’ above for further discussion of
these awards.
All Other All Other
Stock Option Grant
Awards: Awards: Exercise Date Fair
Number Number of or Base Value of
Estimated Possible Payouts Under Estimated Possible Payouts Under of Shares Securities Price of Stock and
Non-Equity Incentive Plan Awards Equity Incentive Plan Awards of Stock Underlying Option Option
Grant Threshold Target Maximum Threshold Target Maximum or Units Options Awards Awards
Name Date ($) ($) ($) (#) (#) (#) (#) (#) ($/Sh)(1) ($)(2)
Mr. Dreiling — 863,873 1,727,746 5,183,237 — — — — — — —
3/18/14 — — — — — — — 161,817 57.91 2,790,016
3/18/14 — — — — — — 30,170 — — 1,747,145
3/18/14 — — — 15,162 30,324 90,972 — — — 1,756,063
Mr. Tehle — 237,257 474,514 1,423,543 — — — — — — —
3/18/14 — — — — — — — 27,812 57.91 479,529
3/18/14 — — — — — — 5,185 — — 300,263
3/18/14 — — — 2,606 5,212 15,636 — — — 301,827
Mr. Vasos — 307,350 614,700 1,844,100 — — — — — — —
3/18/14 — — — — — — — 37,926 57.91 653,913
3/18/14 — — — — — — 7,071 — — 409,482
3/18/14 — — — 3,554 7,107 21,321 — — — 411,566
Mr. D’Arezzo — 216,426 432,851 1,298,554 — — — — — — —
3/18/14 — — — — — — — 27,812 57.91 479,529
3/18/14 — — — — — — 5,185 — — 300,263
3/18/14 — — — 2,606 5,212 15,636 — — — 301,827
Mr. Sparks — 207,413 414,827 1,244,480 — — — — — — —
3/18/14 — — — — — — — 27,812 57.91 479,529
3/18/14 — — — — — — 5,185 — — 300,263
3/18/14 — — — 2,606 5,212 15,636 — — — 301,827
(1) The per share exercise price was calculated based on the closing market price of one share of our common stock on the date of
grant as reported by the NYSE.
(2) Represents the aggregate grant date fair value of each equity award, computed in accordance with FASB ASC Topic 718. For equity
awards that are subject to performance conditions, the value at the grant date is based upon the probable outcome of such
conditions. For information regarding the assumptions made in the valuation of these awards, see Note 10 of the annual
consolidated financial statements included in our 2014 Form 10-K.
39