Delta Airlines 2006 Annual Report Download - page 84
Download and view the complete annual report
Please find page 84 of the 2006 Delta Airlines annual report below. You can navigate through the pages in the report by either clicking on the pages listed below, or by using the keyword search tool below to find specific information within the annual report.-
 1
1 -
2
-
3
-
4
-
5
-
6
-
7
-
8
-
9
-
10
-
11
-
12
-
13
-
14
-
15
-
16
-
17
-
18
-
19
-
20
-
21
-
22
-
23
-
24
-
25
-
26
-
27
-
28
-
29
-
30
-
31
-
32
-
33
-
34
-
35
-
36
-
37
-
38
-
39
-
40
-
41
-
42
-
43
-
44
-
45
-
46
-
47
-
48
-
49
-
50
-
51
-
52
-
53
-
54
-
55
-
56
-
57
-
58
-
59
-
60
-
61
-
62
-
63
-
64
-
65
-
66
-
67
-
68
-
69
-
70
-
71
-
72
-
73
-
 74
74 -
 75
75 -
 76
76 -
 77
77 -
 78
78 -
 79
79 -
 80
80 -
 81
81 -
 82
82 -
 83
83 -
 84
84 -
 85
85 -
 86
86 -
 87
87 -
 88
88 -
 89
89 -
 90
90 -
 91
91 -
 92
92 -
 93
93 -
 94
94 -
95
-
96
-
97
-
98
-
99
-
100
-
101
-
102
-
103
-
104
-
105
-
106
-
107
-
108
-
109
-
110
-
111
-
112
-
113
-
114
-
115
-
116
-
117
-
118
-
119
-
120
-
121
-
122
-
123
-
124
-
125
-
126
-
127
-
128
-
129
-
130
-
131
-
132
-
133
-
134
-
135
-
136
-
137
-
138
-
139
-
140
-
141
-
142
-
143
-
144
-
145
-
146
-
147
-
148
-
149
-
150
-
151
-
152
-
153
-
154
-
155
-
156
-
157
-
158
-
159
-
160
-
161
-
162
-
163
-
164
-
165
-
166
-
167
-
168
-
169
-
170
-
171
-
172
-
173
-
174
-
175
-
176
-
177
-
178
-
179
-
180
-
181
-
182
-
183
-
184
-
185
-
186
-
187
-
188
-
189
-
190
-
191
-
192
-
193
-
194
-
195
-
196
-
197
-
198
-
199
-
200
-
201
-
202
-
203
-
204
-
205
-
206
-
207
-
208
-
209
-
210
-
211
-
212
-
213
-
214
-
215
-
216
-
217
-
218
-
219
-
220
-
221
-
222
-
223
-
224
-
225
-
226
-
227
-
228
-
229
-
230
-
231
-
232
-
233
-
234
-
235
-
236
-
237
-
238
-
239
-
240
-
241
-
242
-
243
-
244
-
245
-
246
-
247
-
248
-
249
-
250
-
251
-
252
-
253
-
254
-
255
-
256
-
257
-
258
-
259
-
260
-
261
-
262
-
263
-
264
-
265
-
266
-
267
-
268
-
269
-
270
-
271
-
272
-
273
-
274
-
275
-
276
-
277
-
278
-
279
-
280
-
281
-
282
-
283
-
284
-
285
-
286
-
287
-
288
-
289
-
290
-
291
-
292
-
293
-
294
-
295
-
296
-
297
-
298
-
299
-
300
-
301
-
302
-
303
-
304
-
305
-
306
-
307
-
308
-
309
-
310
-
311
-
312
-
313
-
314
 |
 |

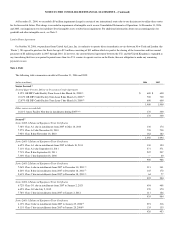
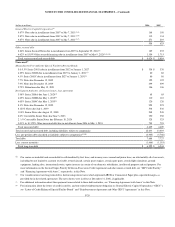
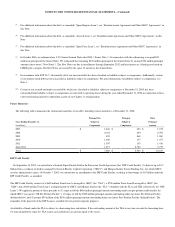
NOTES TO THE CONSOLIDATED FINANCIAL STATEMENTS – (Continued)
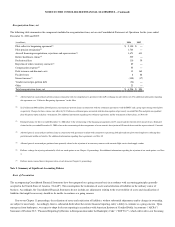
We did not grant any stock options during the year ended December 31, 2006. The estimated fair values of stock options granted during the years ended
December 31, 2005 and 2004 were derived using the Black-Scholes model. The following table includes the assumptions used in estimating fair values and
the resulting weighted average fair value of stock options granted in the periods presented:
Stock Options Granted
Assumption 2006 2005 2004
Risk-free interest rate — 3.8% 3.1%
Average expected life of stock options (in years) — 3.0 3.2
Expected volatility of common stock — 73.6% 68.8%
Weighted average fair value of a stock option granted $ — $ 2 $ 3
The following table reflects for the years ended December 31, 2005 and 2004, the pro forma impact to net loss and basic and diluted loss per share had
we accounted for our stock-based compensation plans under the fair value method in accordance with SFAS 123, as amended.
Year Ended December
31,
(in millions, except per share data) 2005 2004
Net loss:
As reported $ (3,818) $ (5,198)
Stock option compensation expense determined under the fair value method (108) (38)
As adjusted for the fair value method under SFAS 123R $ (3,926) $ (5,236)
Basic and diluted loss per share:
As reported $ (23.75) $ (41.07)
As adjusted for the fair value method under SFAS 123R $ (24.42) $ (41.36)
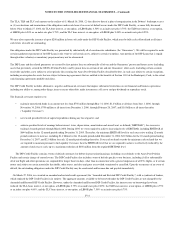
On March 20, 2006, we filed with the Bankruptcy Court a motion to reject our then outstanding stock options to avoid the administrative and other costs
associated with these awards. The Bankruptcy Court granted our motion, which resulted in substantially all of our stock options being rejected effective
March 31, 2006. In the March 2006 quarter, we recorded in our Consolidated Statement of Operations (1) $8 million of compensation expense in conjunction
with the adoption of SFAS 123R, which is recorded in salaries and related costs and (2) $55 million of compensation expense associated with the rejection of
stock options, which is classified in reorganization items, net and represents the unamortized fair value of previously granted stock options when we rejected
these stock options.
For additional information about our stock options, see Note 12.
Fair Value of Financial Instruments
We record our cash equivalents and short-term investments at cost, which we believe approximates fair value due to their short-term maturities. The
estimated fair values of other financial instruments, including debt and derivative instruments, have been determined using available market information and
valuation methodologies, primarily discounted cash flow analyses and the Black-Scholes model.
The aggregate fair value of our secured and unsecured debt, based primarily on reported market values, was $11.5 billion and $10.5 billion at December
31, 2006 and 2005 (which includes debt classified as liabilities subject to compromise), respectively. For additional information about our debt, see Note 6.
Reclassifications
Under our Visa/MasterCard Processing Agreement, the credit card processor (“Processor”) is permitted to withhold payment from our receivables of an
amount (“Cash Reserve”) that is equal to the Processor’s potential liability for tickets purchased with Visa or MasterCard which have not yet been used for
travel. The Cash Reserve is recorded in Restricted cash on our Consolidated Balance Sheets. See Note 6 for additional information related to our processing
agreement.
For the year ended December 31, 2006, the change in Cash Reserve has been reported as a component of operating activities on our Consolidated
Statement of Cash Flows to better reflect the nature of the restricted cash activities. Prior to 2006, we presented such change as an investing activity. We
have reclassified prior period amounts to be consistent with the current year presentation. These reclassifications resulted in a decrease to cash flows from