Delta Airlines 2006 Annual Report Download - page 107
Download and view the complete annual report
Please find page 107 of the 2006 Delta Airlines annual report below. You can navigate through the pages in the report by either clicking on the pages listed below, or by using the keyword search tool below to find specific information within the annual report.-
 1
1 -
2
-
3
-
4
-
5
-
6
-
7
-
8
-
9
-
10
-
11
-
12
-
13
-
14
-
15
-
16
-
17
-
18
-
19
-
20
-
21
-
22
-
23
-
24
-
25
-
26
-
27
-
28
-
29
-
30
-
31
-
32
-
33
-
34
-
35
-
36
-
37
-
38
-
39
-
40
-
41
-
42
-
43
-
44
-
45
-
46
-
47
-
48
-
49
-
50
-
51
-
52
-
53
-
54
-
55
-
56
-
57
-
58
-
59
-
60
-
61
-
62
-
63
-
64
-
65
-
66
-
67
-
68
-
69
-
70
-
71
-
72
-
73
-
74
-
75
-
76
-
77
-
78
-
79
-
80
-
81
-
82
-
83
-
84
-
85
-
86
-
87
-
88
-
89
-
90
-
91
-
92
-
93
-
94
-
95
-
96
-
 97
97 -
 98
98 -
 99
99 -
 100
100 -
 101
101 -
 102
102 -
 103
103 -
 104
104 -
 105
105 -
 106
106 -
 107
107 -
 108
108 -
 109
109 -
 110
110 -
 111
111 -
 112
112 -
 113
113 -
 114
114 -
 115
115 -
 116
116 -
 117
117 -
118
-
119
-
120
-
121
-
122
-
123
-
124
-
125
-
126
-
127
-
128
-
129
-
130
-
131
-
132
-
133
-
134
-
135
-
136
-
137
-
138
-
139
-
140
-
141
-
142
-
143
-
144
-
145
-
146
-
147
-
148
-
149
-
150
-
151
-
152
-
153
-
154
-
155
-
156
-
157
-
158
-
159
-
160
-
161
-
162
-
163
-
164
-
165
-
166
-
167
-
168
-
169
-
170
-
171
-
172
-
173
-
174
-
175
-
176
-
177
-
178
-
179
-
180
-
181
-
182
-
183
-
184
-
185
-
186
-
187
-
188
-
189
-
190
-
191
-
192
-
193
-
194
-
195
-
196
-
197
-
198
-
199
-
200
-
201
-
202
-
203
-
204
-
205
-
206
-
207
-
208
-
209
-
210
-
211
-
212
-
213
-
214
-
215
-
216
-
217
-
218
-
219
-
220
-
221
-
222
-
223
-
224
-
225
-
226
-
227
-
228
-
229
-
230
-
231
-
232
-
233
-
234
-
235
-
236
-
237
-
238
-
239
-
240
-
241
-
242
-
243
-
244
-
245
-
246
-
247
-
248
-
249
-
250
-
251
-
252
-
253
-
254
-
255
-
256
-
257
-
258
-
259
-
260
-
261
-
262
-
263
-
264
-
265
-
266
-
267
-
268
-
269
-
270
-
271
-
272
-
273
-
274
-
275
-
276
-
277
-
278
-
279
-
280
-
281
-
282
-
283
-
284
-
285
-
286
-
287
-
288
-
289
-
290
-
291
-
292
-
293
-
294
-
295
-
296
-
297
-
298
-
299
-
300
-
301
-
302
-
303
-
304
-
305
-
306
-
307
-
308
-
309
-
310
-
311
-
312
-
313
-
314
 |
 |

NOTES TO THE CONSOLIDATED FINANCIAL STATEMENTS – (Continued)
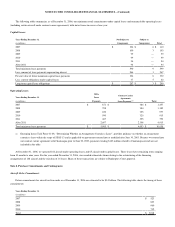
Note 9. Income Taxes
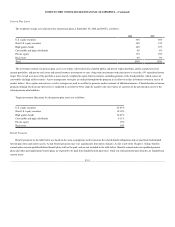
Deferred income taxes reflect the net tax effect of temporary differences between the carrying amounts of assets and liabilities for financial reporting
purposes and income tax purposes (see Note 2 for information about our accounting policy for income taxes). The following table shows significant
components of our deferred tax assets and liabilities at December 31, 2006 and 2005:
(in millions) 2006 2005
Deferred tax assets:
Net operating loss carryforwards $ 2,921 $ 3,246
Additional minimum pension liability (see Note 10) 615 1,565
Postretirement benefits 681 716
Other employee benefits 2,898 992
AMT credit carryforward 346 346
Rent expense 1,215 398
Other 598 757
Valuation allowance (5,169) (3,954)
Total deferred tax assets $ 4,105 $ 4,066
Deferred tax liabilities:
Depreciation and amortization $ 3,850 $ 3,763
Other 259 336
Total deferred tax liabilities $ 4,109 $ 4,099
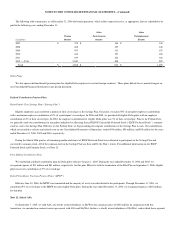
The following table shows the current and noncurrent deferred tax (liabilities) assets, recorded on our Consolidated Balance Sheets at December 31,
2006 and 2005:
(in millions) 2006 2005
Current deferred tax assets, net $ 402 $ 99
Noncurrent deferred tax liabilities, net (406) (132)
Total deferred tax liabilities, net $ (4) $ (33)
The current and noncurrent components of our deferred tax balances are generally based on the balance sheet classification of the asset or liability
creating the temporary difference. If the deferred tax asset or liability is not based on a component of our balance sheet, such as our net operating loss
(“NOL”) carryforwards, the classification is presented based on the expected reversal date of the temporary difference. Our valuation allowance has been
classified as current or noncurrent based on the percentages of current and noncurrent deferred tax assets to total deferred tax assets.
At December 31, 2006, we had (1) $346 million of federal alternative minimum tax (“AMT”) credit carryforwards, which do not expire and (2)
approximately $7.8 billion of federal and state pretax NOL carryforwards, substantially all of which will not begin to expire until 2022. Our ability to utilize
our AMT and NOL carryforwards will be subject to significant limitation if, as a result of our Chapter 11 proceedings, we undergo an ownership change for
purposes of Section 382 of the Internal Revenue Code of 1986, as amended. For additional information about the Bankruptcy Court’s order designed to assist
us in preserving our NOLs, see Note 1.
F-42